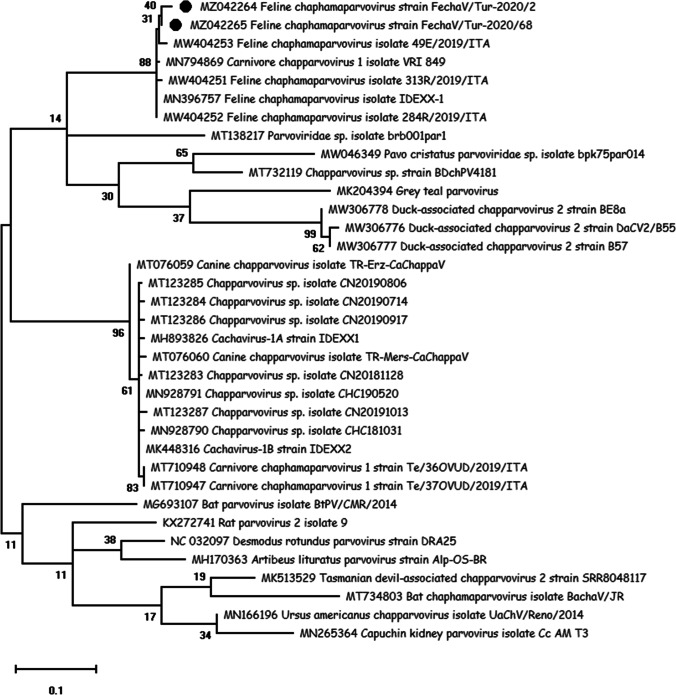
Fig. 2.
Phylogeny of FeChPV NP nt sequences. The tree was constructed using the maximum likelihood method. Bootstrap support values based on 1000 replicates are given at the nodes. Black circles represent the FeChPV isolates in the present study. Others are ChPV strains or isolates from different countries

