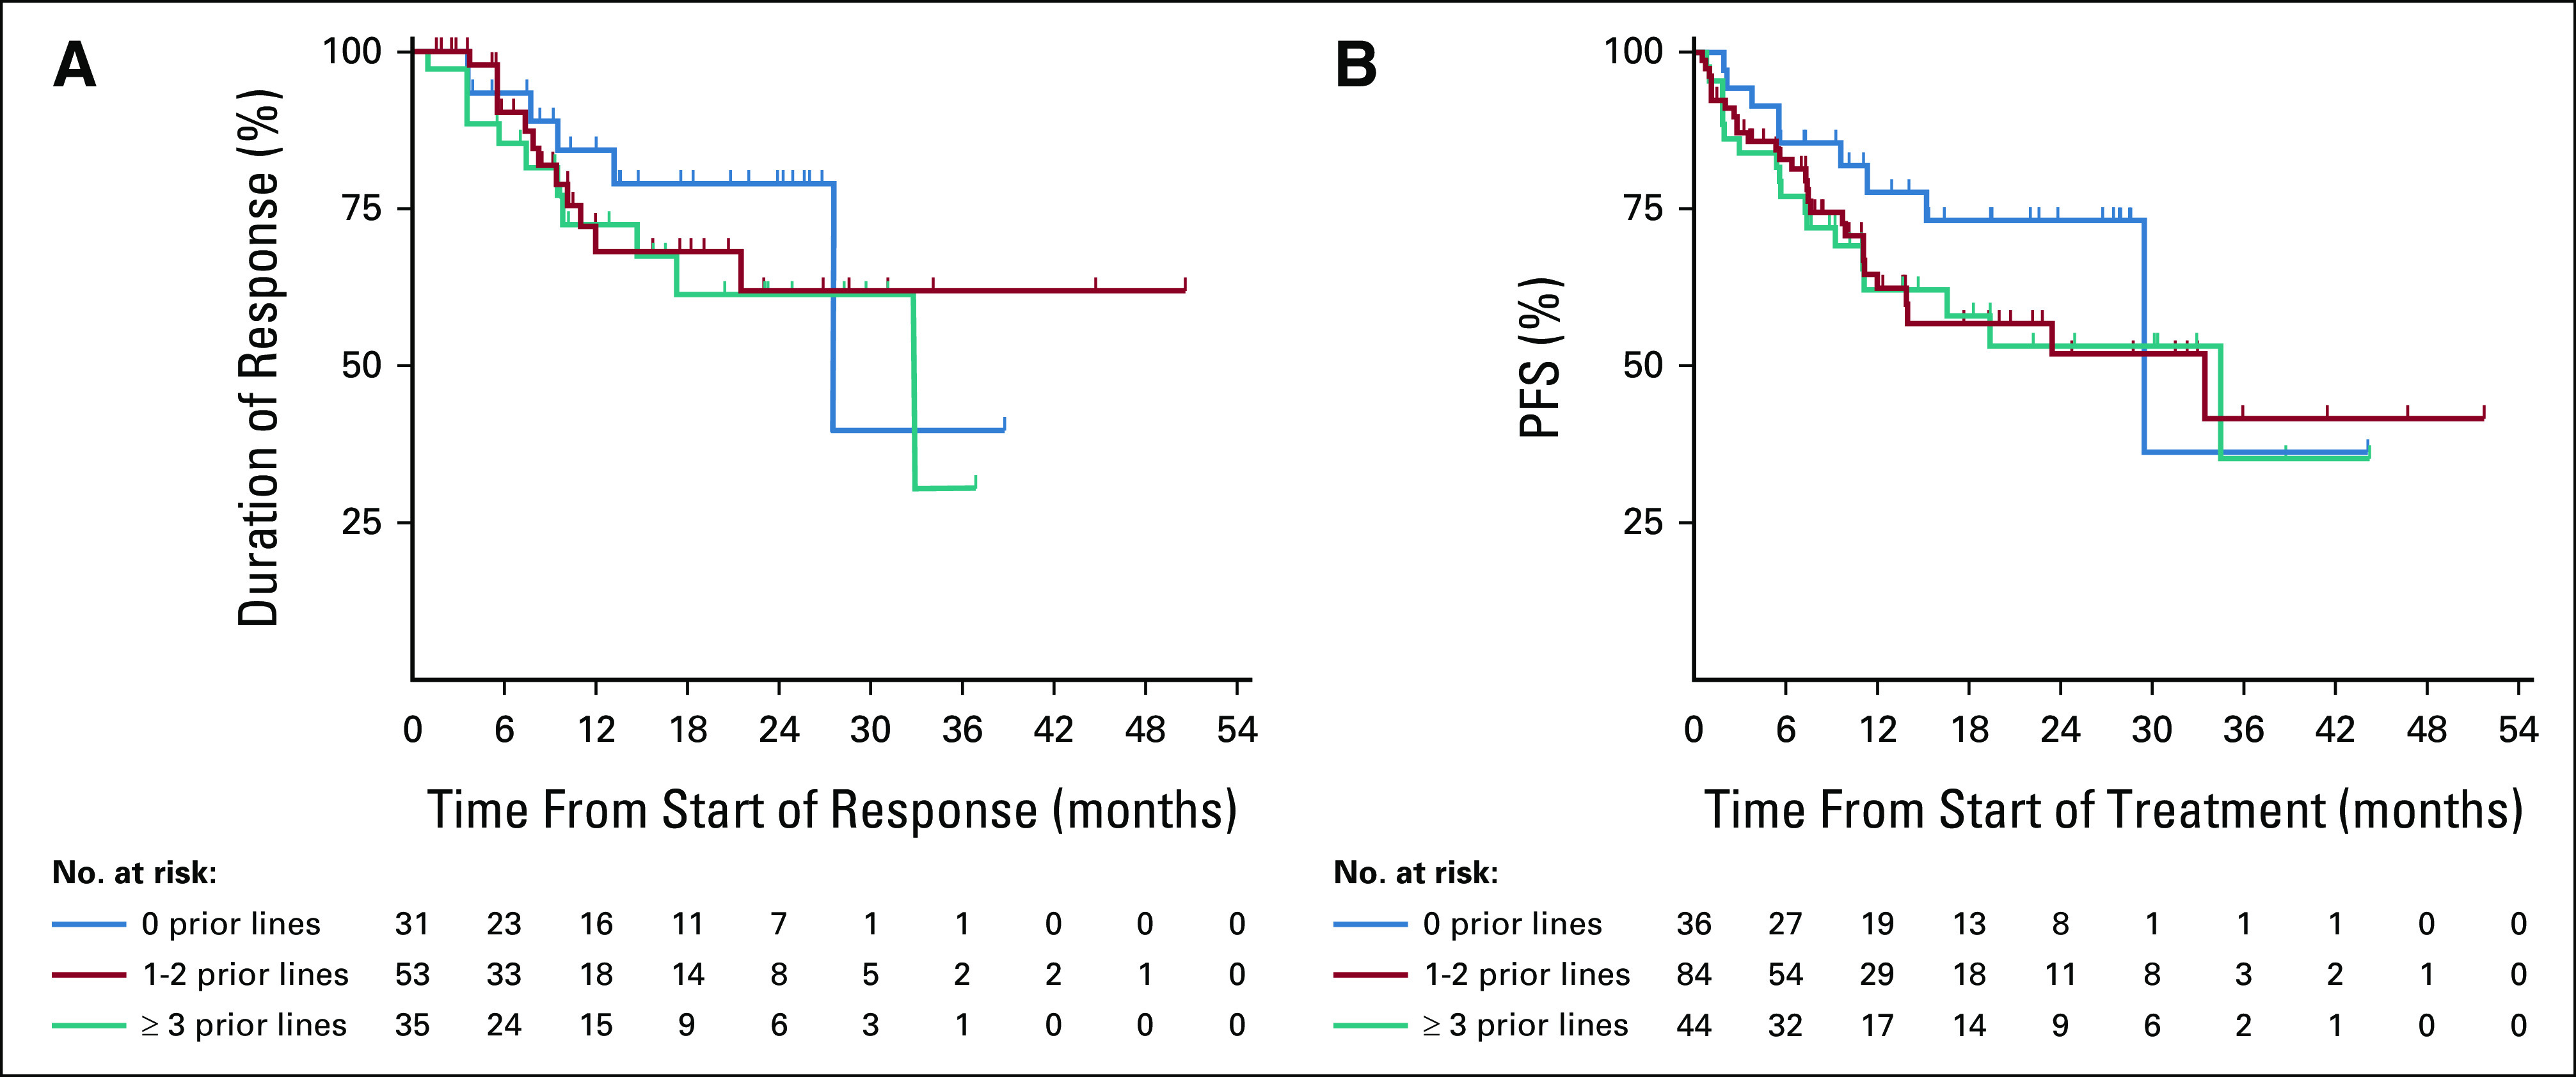
FIG 1.

Kaplan-Meier plots of DOR and PFS according to prior lines of therapy (0, 1-2, or ≥ 3): (A) DOR in patients with confirmed responses and (B) PFS. Tick marks indicate censored patients. DOR, duration of response; PFS, progression-free survival.
