. 2021 Aug 13;10:e64790. doi: 10.7554/eLife.64790

Figure 1. Geographic distribution of reefs and bleaching responses after experimental warming.

(A) Map of 39 reef locations surveyed, arranged in groups in the North (blue), West (red), East (green), and South (yellow). Ten reefs that are outlined in purple are at fore reef locations. (B) Mean proportion of symbionts in tissues from corals before and after heating. (C) The fraction of symbionts retained after heating across all 221 colonies. Accompanying source data are available as Figure 1—source data 1data.

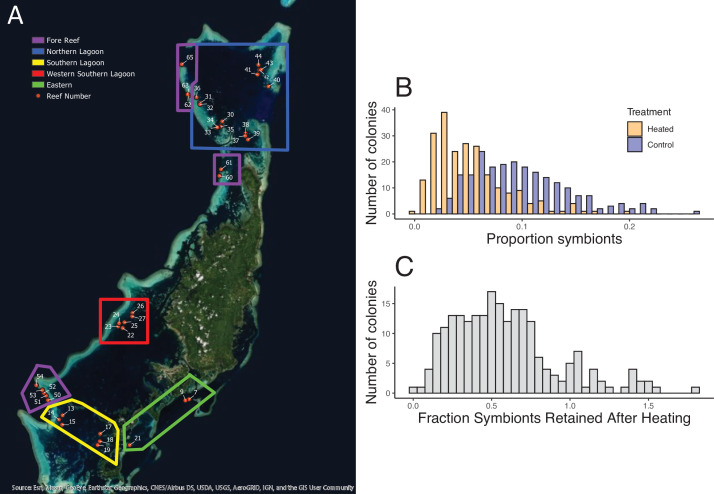
Figure 1—source data 1. Colony by colony bleaching response to experimental warming.

Figure 1.

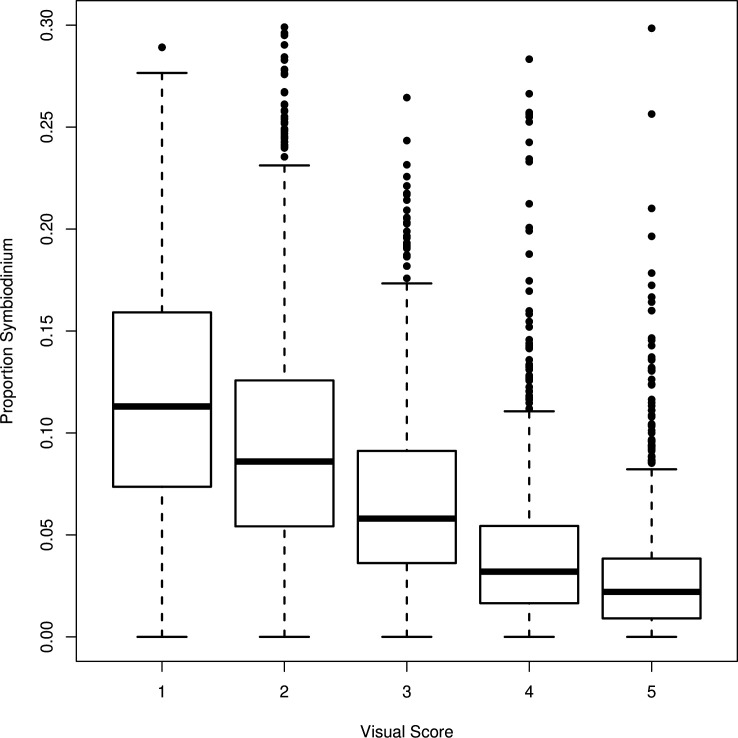
Figure 1—figure supplement 1. Range of symbiont cell concentration by visual bleaching score category.

Figure 1—figure supplement 1.

Symbiont cell proportions are highly correlated with visual bleaching score, though there is high variance particularly among colonies with low bleaching scores. Note: Measurements are of all colonies from the experimental heat treatments as well as the control treatments. Accompanying source data are available as Figure 1—figure supplement 1—source data 1.data.
Figure 1—figure supplement 1—source data 1. Symbiont density as measured by flow cytometry and visual bleaching score.
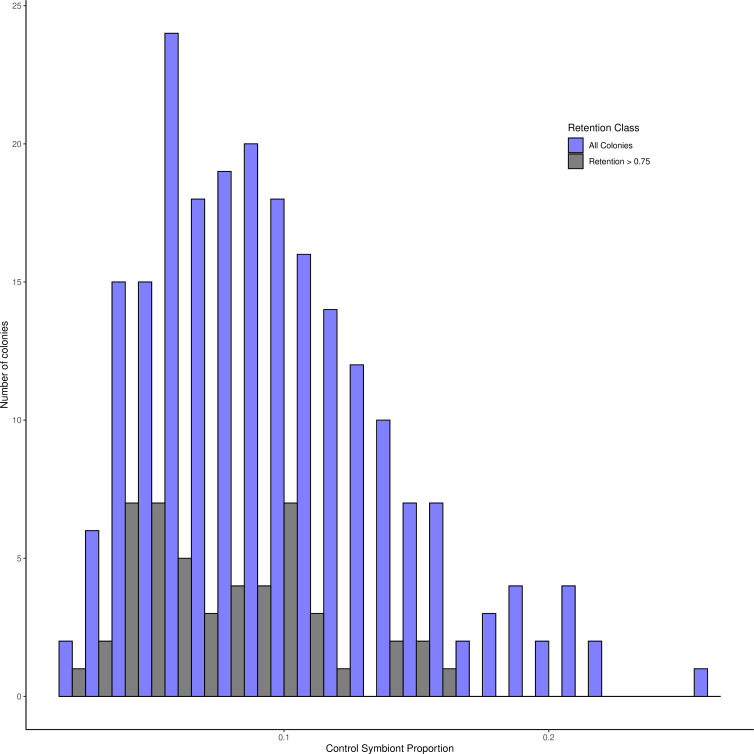
Figure 1—figure supplement 2. Colonies with high symbiont retention after heat stress tend to have lower levels of symbionts (gray bars), compared to symbiont load across all colonies (blue bars).

Figure 1—figure supplement 2.

Accompanying source data are available as Figure 1—figure supplement 2—source data 1.data.
Figure 1—figure supplement 2—source data 1. Colony by colony symbiont load pre- and post-experimental bleaching.