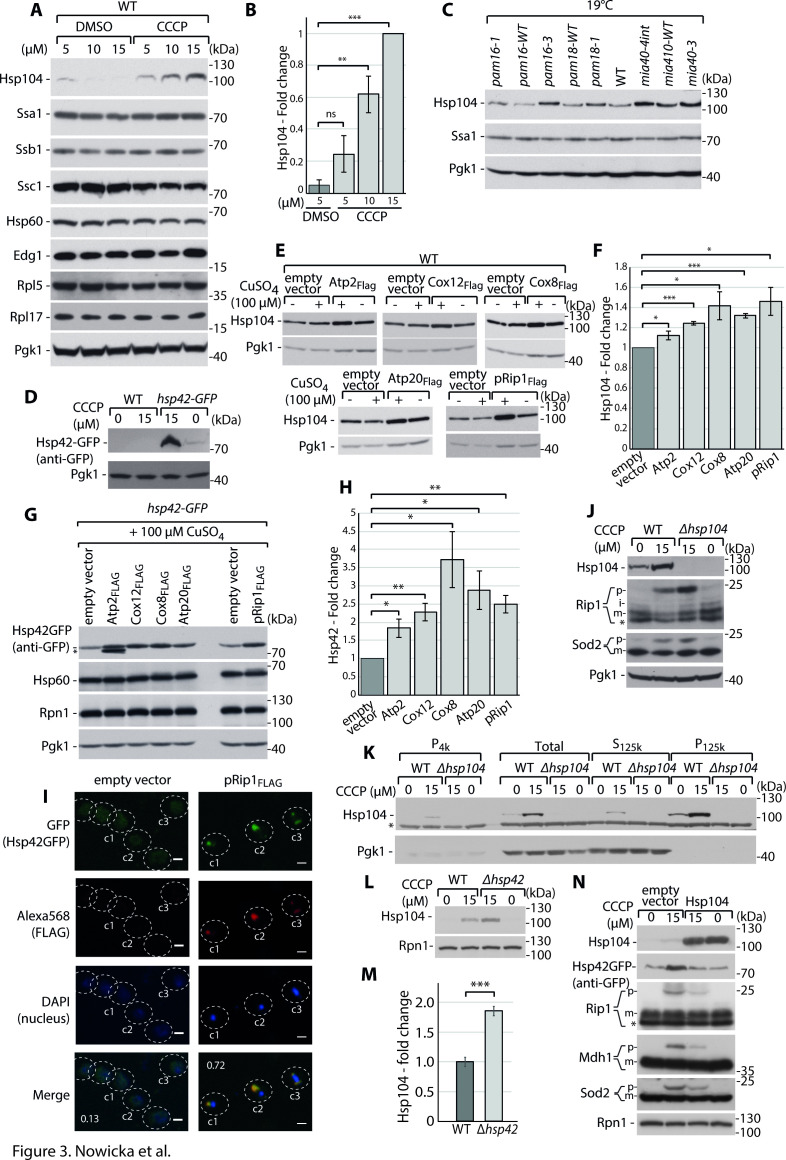
Figure 3. Cytosolic mitochondrial protein aggregation elicits a molecular chaperone response to restore cellular homeostasis.
( A-D) Hsp104 and Hsp42 are upregulated in response to impairment in mitochondrial protein import. (A) Total protein cell extracts from WT yeast cells were grown at 24°C and treated with 0, 5, 10, or 15 µM carbonyl cyanide m-chlorophenyl hydrazine (CCCP) for 30 min. (B) Quantified changes in Hsp104 protein expression from (A). Quantified data are shown as mean ± SEM. n = 3. (C) Total protein cell extracts from WT (YPH499), pam16-WT, pam16-1, pam16-3, pam18-WT, pam18-1, mia40-4WT, mia40-4int, and mia40-3 grown at a permissive temperature of 19°C and shifted to a restrictive temperature of 37°C for 3 hr. (D) Total protein cell extracts from WT yeast cells and hsp42-GFP yeast grown at 24°C and treated with 0 or 15 µM CCCP for 30 min. (E–H) Metastable protein overexpression increases the expression levels of molecular chaperones. Total protein cell extracts that expressed the indicated metastable proteins or an empty vector control for 4 hr showed higher levels of Hsp104 (E) and Hsp42 (G). (F, H) Quantitative analyses of Hsp104 (F) and Hsp42 (H) levels from (E) and (G), respectively, are shown. Quantified data are shown as the mean ± SEM. n = 3. (I) Aggregated metastable proteins co-localize with Hsp42-GFP. Representative confocal microscope images show metastable proteins that were tagged with Alexa568 fluorophore in the hsp42-GFP yeast strain. Scale bar = 2 μm. See Materials and methods for further details. Pearson’s correlation coefficients were calculated for the indicated cells for each condition. (J) Total protein cell extracts from WT yeast cells and Δhsp104 yeast grown at 24°C and treated with 0 or 15 µM CCCP for 30 min. (K) SDS-PAGE analysis of aggregation assay fractions of samples of WT yeast cells and Δhsp104 yeast grown at 24°C and treated with 0 or 15 µM CCCP for 30 min, with 2% sucrose as the carbon source. (L) Total protein cell extracts from WT yeast cells and Δhsp42 yeast grown at 24°C and treated with 0 or 15 µM CCCP for 30 min. (M) Quantified changes in Hsp104 expression from (L). Quantified data are shown as the mean ± SEM. n = 3. (N) Total protein cell extracts from WT yeast cells and yeast cells that expressed Hsp104 grown overnight at 24°C and treated with 0 or 15 µM CCCP for 30 min. In (A, C–E, G, J–L, N), the samples were separated by SDS-PAGE and identified by western blot with specific antisera. Each experiment was repeated three times. p: presequence protein; m: mature protein; *: nonspecific. Significance in (B, F, H, M): *p<0.05, **p≤0.01, ***p≤0.001, ****p≤0.0001; ns: nonsignificant.


