. 2021 Jul 20;10:e65484. doi: 10.7554/eLife.65484

Figure 4. Mitochondrial protein import dysfunction enhances impairment in cellular homeostasis.

(A–D) Metastable proteins cause the accumulation and aggregation of other mitochondrial precursor proteins. (A) Total protein cell extracts from hsp42-GFP cells that expressed selected metastable proteins or an empty vector control overnight. Changes for pRip1 (B) and pSod2 (C) were quantified. Quantified data are shown as the mean ± SEM. n = 3. (D) SDS-PAGE analysis of aggregation assay fractions of hsp42-GFP yeast cells that overexpressed Atp2FLAG or an empty vector control for 3 hr, with 2% sucrose as the carbon source. Insoluble, S4k aggregation assay fraction. (E) Total protein cell extract from pam16-3 mutant yeast strains treated with 75 µM MG132 for 1 hr under permissive growth conditions and subsequently heat shocked at 37°C for 0, 1, 2, or 4 hr. (F, G) Representative confocal images of α-Syn WT-GFP (F) and A53T-GFP (G) aggregates in WT (pam16-WT) and pam16-3 yeast strains. α-Syn WT-GFP and A53T-GFP were induced for 4 hr at 19°C and for an additional 2 hr at 19°C for control or at 37°C for heat shock. Scale bar = 2 μm. See Materials and methods for further details. The bar plot shows the average number of aggregates per cell. The data are shown as the mean ± SEM. n = 57–83 for α-Syn WT-GFP. n = 154–175 for α-Syn A53T-GFP. (H) Total cell extracts of WT (pam16-WT) and pam16-3 yeast strains that expressed α-Syn WT-GFP induced for 4 hr at 19°C and for an additional 2 hr at 19°C for control or 37°C for heat shock. (I) Quantitative analysis of pRip1 from (H). Quantified data are shown as the mean ± SEM. n = 3. In (A, D, E, H), protein samples were separated by SDS-PAGE and identified by western blot with specific antisera. Each experiment was repeated three times. For western blot: p: presequence protein; i: intermediate protein; m: mature protein; *: nonspecific. *p<0.05, **p≤0.01, ***p≤0.001, ****p≤0.0001; ns: nonsignificant.

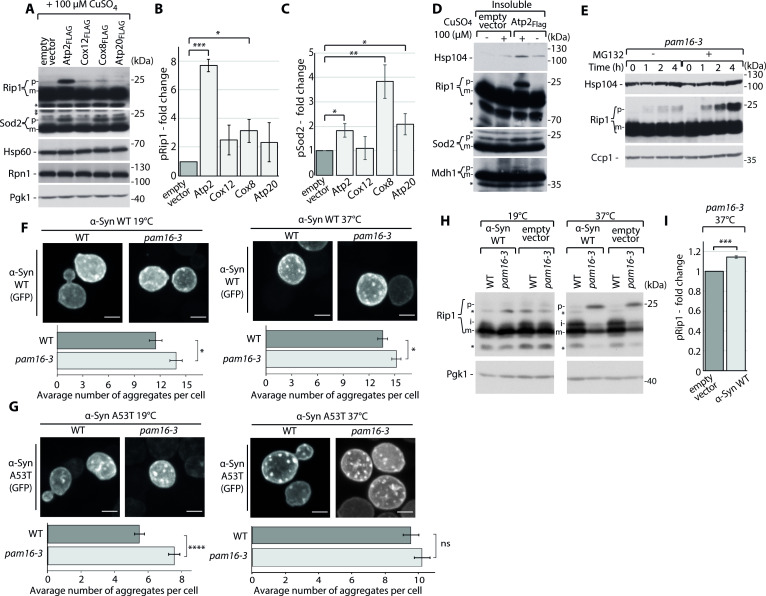
Figure 4—source data 1. Source data for the average number of aggregates per cell and average aggregates size: α-Syn WT-GFP and α-Syn A53T-GFP for WT (pam16-WT) and pam16-3 strains at 19 and 37°C.

Figure 4.

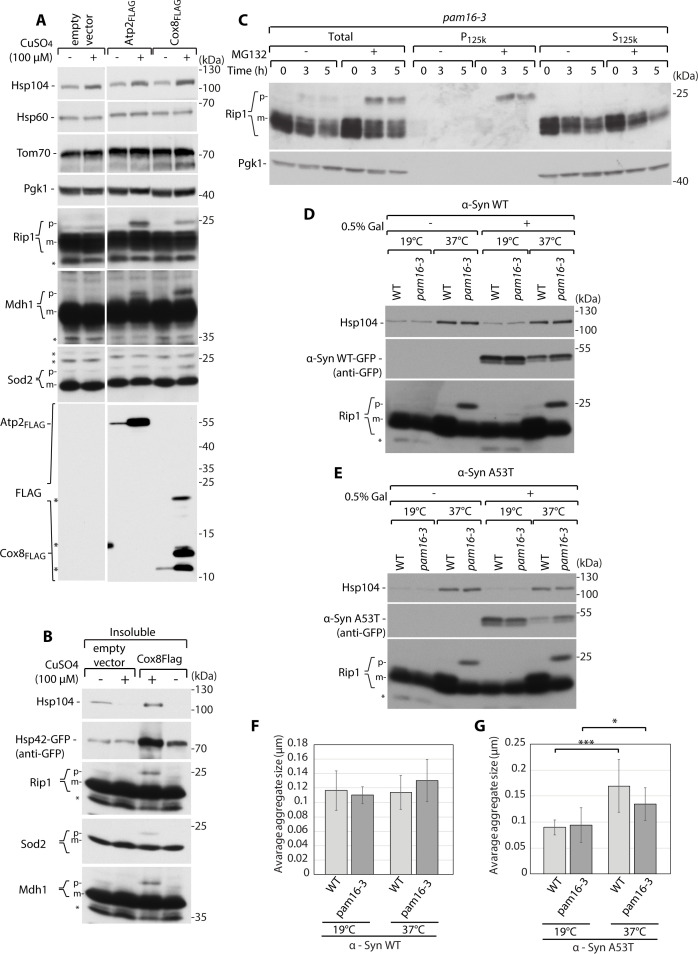
Figure 4—figure supplement 1. Effects of mitochondrial protein import dysfunction on cellular homeostasis.

Figure 4—figure supplement 1.

(A) The presence of metastable proteins results in the cytosolic accumulation of other mitochondrial precursors proteins, showing the SDS-PAGE analysis of total protein cell extracts from hsp42-GFP yeast cells that expressed Atp2FLAG, Cox8FLAG, or an empty vector control for 3 hr, corresponding to the aggregation assay from Figure 4D, Figure 4—figure supplement 1B. (B) SDS-PAGE analysis of aggregation assay fractions of hsp42-GFP yeast cells that overexpressed Cox8FLAG or an empty vector control for 3 hr, with 2% sucrose as the carbon source. Insoluble, S4k aggregation assay fraction. (C) SDS-PAGE analysis of aggregation assay fractions of the pam16-3 mutant yeast strain grown at a permissive temperature of 19°C to the mid-logarithmic phase. Cells were treated with 75 µM MG132 for 1 hr and heat shocked at 37°C for 0, 3, or 5 hr, with 2% galactose as the carbon source. (D, E) WT (pam16-WT) and pam16-3 yeast strains that expressed α-Syn WT-GFP (D) or A53T-GFP (E) samples that were used for the confocal images presented in Figure 4F and G were subjected to the SDS-PAGE analysis of total protein cell extracts. (F, G) Quantification of average aggregate size (in µm) for WT and pam16-3 yeast strains that expressed α-Syn WT-GFP (F) or A53T-GFP (G) from Figure 4F and G, respectively. Quantified data are shown as the mean ± SD. n = 10. In (A–E), protein samples were separated by SDS-PAGE and identified by western blot with specific antisera. Each experiment was repeated three times. *p<0.05, **p≤0.01, ***p≤0.001, ****p≤0.0001; ns: nonsignificant.