. 2021 Jul 20;10:e65484. doi: 10.7554/eLife.65484

Figure 5. Mitochondrial dysfunction results in the accumulation of Aβ aggregates in C. elegans.

(A–C) Mitochondrial dysfunction stimulates the aggregation of model proteins in C. elegans. (A) Confocal images of worms that expressed wrmScarlet and green fluorescent protein (GFP) in body wall muscle [pmyo-3::wrmScarlet+ pmyo::GFP]. The zoomed image is presented in the white box. Scale bar = 20 μm. (B) Number of red fluorescent protein (RFP) aggregates at different days of adulthood of strain [pmyo-3::wrmScarlet+ pmyo-3::GFP] strain upon dnj-21 RNAi. n = 14–16 worms for empty vector. n = 8–16 worms for dnj-21 RNAi. (C) Number of GFP aggregates present at different days of adulthood of [pmyo-3::wrmScarlet+ pmyo-3::GFP] strain upon dnj-21 RNAi. n = 14–16 worms for empty vector. n = 8–16 worms for dnj-21 RNAi. (D) Motility of Parkinson’s disease model strain that expressed α-Syn::YFP in the body wall muscle or control strain that expressed YFP in the body wall muscle upon the silencing of dnj-21. An empty vector was used as the control. Data were obtained using an automated body bend assay. The data are shown as the mean ± SEM, with at least n = 700 for each condition. (E) Protein aggregation under native conditions in worms that expressed Aβ upon dnj-21 RNAi. Worms were cultured at 20°C or shifted to 22 or 25°C. n = 3. (F) Aβ levels were calculated from the native aggregation data in (E). The data are shown as the mean ± SD. n = 3. (G) Motility in worms that expressed Aβ and GFP upon dnj-21 RNAi. The data are shown as the mean ± SEM. n = 50 worms per condition. Overall differences between conditions were assessed by unpaired t-test by assuming equal variance. *p<0.05, **p≤0.01, ***p≤0.001, ****p≤0.0001; ns: nonsignificant.

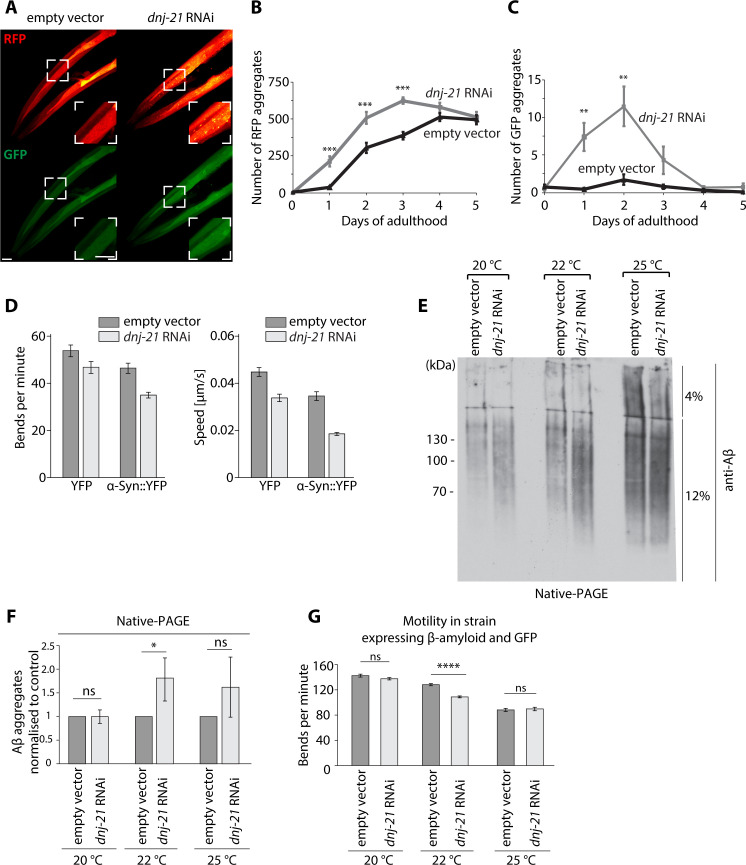
Figure 5—source data 1. Source data for worms that expressed wrmScarlet and green fluorescent protein (GFP) in body wall muscle.
Figure 5—source data 2. Source data for worms that expressed α-Syn::YFP and Aβ.

Figure 5.

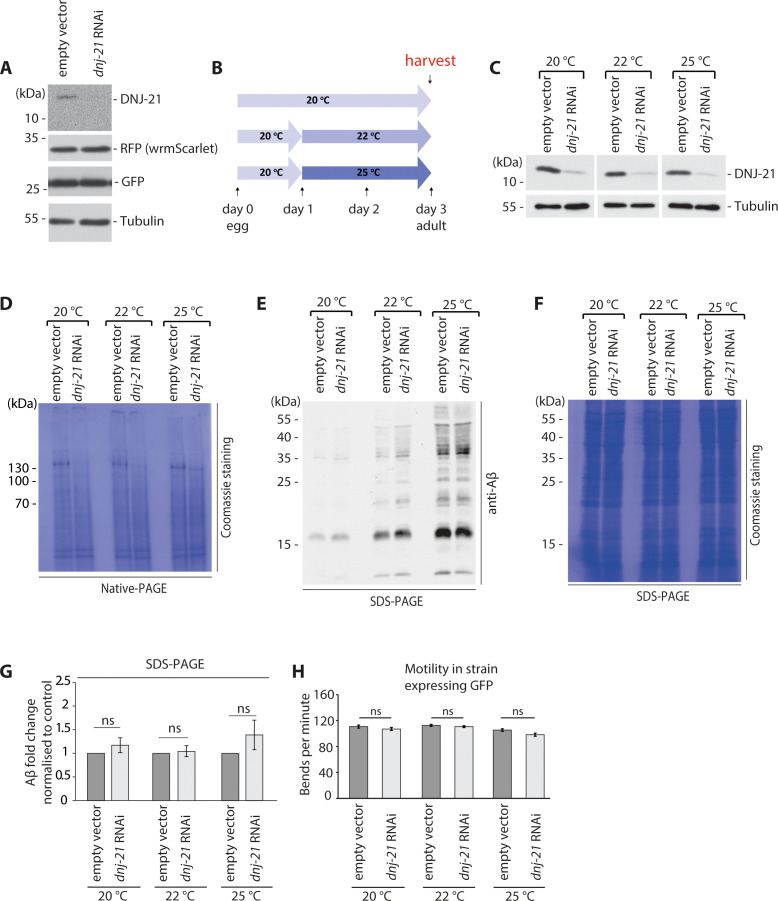
Figure 5—figure supplement 1. Scheme and controls for experiments on mitochondrial dysfunction in C. elegans that resulted in Aβ accumulation.

Figure 5—figure supplement 1.

(A) RNAi silencing effectiveness on protein levels upon dnj-21 RNAi in worms strain [pmyo-3::wrmScarlet+ pmyo::GFP]. (B) Scheme of temperature shifts during worm culture in the experiments that are presented in Figure 5E–G, Figure 5—figure supplement 1D-F. (C) Protein levels in worms that expressed Aβ peptides upon dnj-21 RNAi. Worms were cultured with the indicated temperature shift. n = 3 biological replicates. (D) Coomassie staining as a loading control for data that are presented in Figure 5E. n = 3 biological replicates. (E) SDS-PAGE analysis of aggregate levels in worms that expressed Aβ peptides upon dnj-21 RNAi. n = 3 biological replicates. Worms were cultured at 20°C or with a temperature shift to 22 or 25°C. (F) Coomassie staining as a loading control for data that are presented in (E). n = 3 biological replicates. (G) Aβ levels calculated from the SDS-PAGE analysis of aggregates in (E). The data are shown as the mean ± SD. n = 3. Overall differences between conditions were assessed by unpaired t-test by assuming unequal variance. (H) Motility in worms that expressed green fluorescent protein (GFP) upon dnj-21 RNAi. The data are shown as the mean ± SEM. Overall differences between conditions were assessed by unpaired t-test by assuming equal variance. n = 35 worms for culture at 20°C. n = 60 worms for culture with 22°C shift. n = 50 worms for culture with 25°C shift. *p<0.05, **p≤0.01, ***p≤0.001, ****p≤0.0001; ns: nonsignificant.