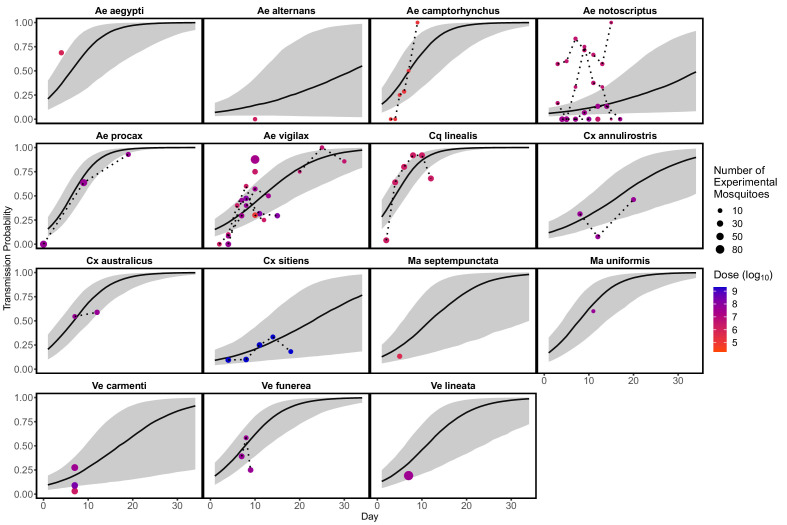
Appendix 1—figure 4. Probability over time that an infected mosquito transmits Ross River virus to a susceptible host given a feeding event.
Data points show the proportion of mosquitoes transmitting virus in laboratory experiments ; point size reflects the total number of mosquitoes exposed to infection and color shows the experimental dose mosquitoes were exposed to. Model predictions are from a binomial GLMM, with day as a fixed effect and random effects of mosquito species (intercept and slope over day) and reference (intercept), fit in R using the package lme4 (Bates et al., 2015). Solid black lines show predicted medians, and grey envelopes are 95% CI constructed from the conditional modes and conditional covariances of the random effect. We did not include dose as a fixed effect because of model fitting/parameter identifiability issues, but show the doses used in the laboratory experiments here (color). Dotted lines connect data points that are from the same experiment.

