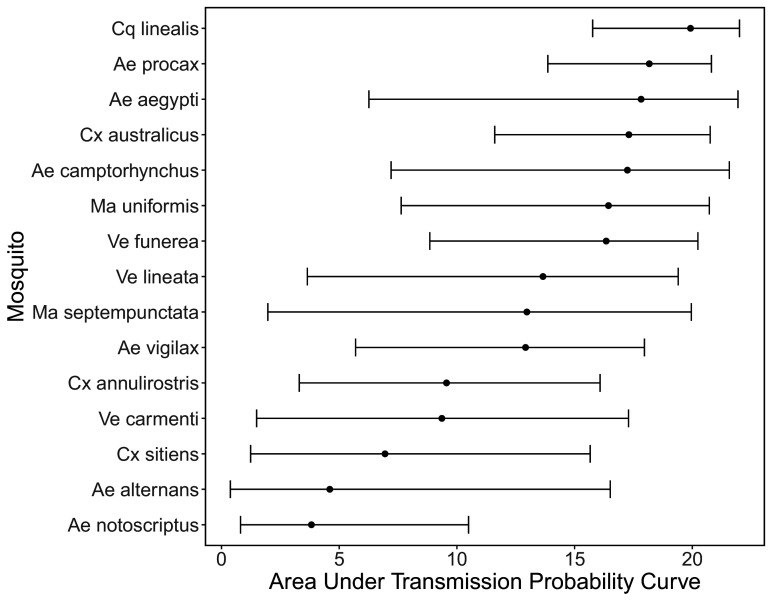
Appendix 1—figure 6. Area under the curve of the mosquito transmission probability curves shown in Appendix 1—figure 4.
Points show medians and error bars show 95% CI. Of all mosquitoes without data just Ve lineata is pictured here as in Appendix 1—figure 4.

