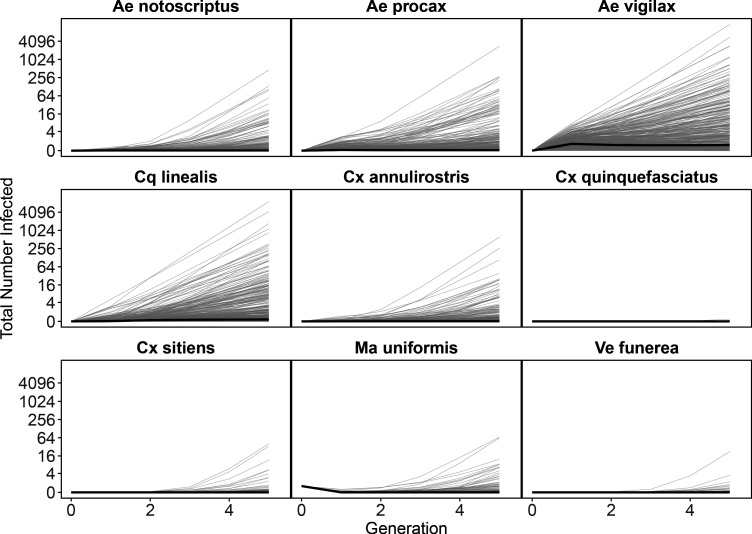
Appendix 2—figure 6. An initial Ma. uniformis infection propagates through the mosquito community.
Starting with a single infected Mansonia uniformis in generation ‘zero’, the next generation matrix approach approximates the number of mosquitoes infected in subsequent generations. All generation one mosquito infections arise from the source Ma. uniformis infecting hosts and those hosts infecting mosquitoes; the plotted number of infections for each mosquito species is the estimated total number of infections in that species arising from all transmission pathways. As these results are generated from the same model that produced the results in Appendix 2—figure 5 (simply with a different perspective) median estimates (bold black line) show slightly increasing numbers of infections in mosquitoes over generations. However, large uncertainty for the number of infections produced by each infected host and mosquito (see Figure 2, Figure 3) results in the possibility of explosive epidemics and thousands of infected individual mosquitoes after a few generations. As in Appendix 2—figure 5, the thin grey black lines are 500 epidemic realizations. Because we assume a fully susceptible host and vector population, this is an epidemic simulation, which would over-estimate the amount of Ross River virus transmission in Brisbane because of the high host immunity in the host population that is ignored here.

