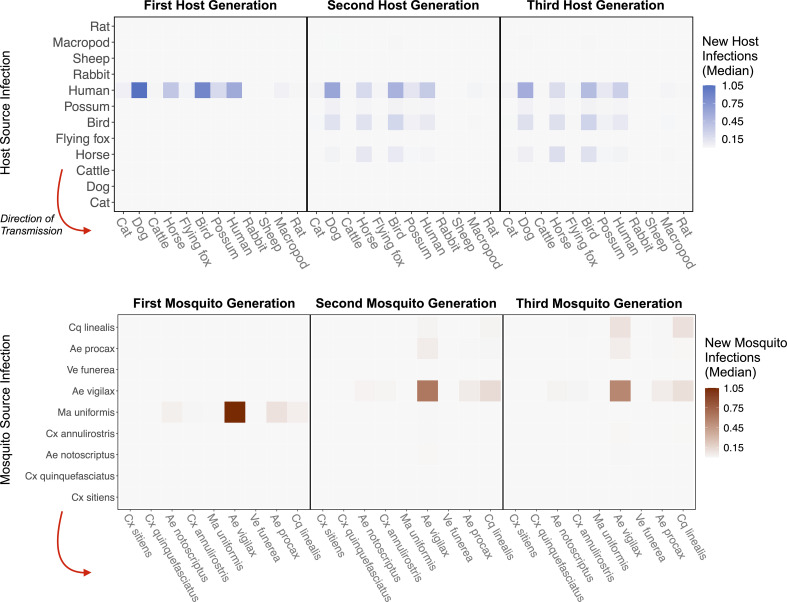
Figure 4. RRV epidemic dynamics propagate through initially naïve host and vector communities.
Epidemics are simulated in two ways: transmission in the host community resulting from an initial infection in a human (top row), or transmission in the mosquito community arising from a source infection in a Ma. uniformis mosquito (bottom row). Each matrix cell contains the median estimated number of new infections in a given species (columns) arising from all infected individuals of a given species in the previous generation (rows). The red arrow shows the direction of infection. We show generations 1–3 here to illustrate how quickly infections propagate through the community and converge on dominant transmission pathways, by generation 3. Uncertainty in the number of new infections in each host and mosquito species over five generations is shown in Appendix 2—figure 5 and Appendix 2—figure 6, respectively.

