. 2021 Sep 22;10:e69795. doi: 10.7554/eLife.69795

Figure 5. DA neuron-specific RNA-seq uncovers neurotoxic insult-induced alterations of mitochondrial pathway gene expression that is in part restored by the AGTR1 inhibitor olmesartan.

(A) A schematic showing the RNA-seq procedure of larval samples from chemical treatment to FACs, library preparation, and differential gene expression analysis. (B) A heatmap of clustering analysis comparing the differential gene expression in DMSO control, olmesartan, CBE, MTZ, MTZ+ olmesartan, and CBE+ olmesartan treatment groups. Gene counts were normalized and analyzed with the R program DESeq2 package. All samples are numbered 1, 2, and 3 to indicate biological replicates. (C–D) Venn diagrams showing the overlapping gene expression alterations between different conditions: MTZ/control and CBE/control (C) and MTZ+ Olmesartan/MTZ and CBE+ Olmesartan/CBE (D) (α = 0.05, FDR = 0.1, Wald test). (E–F) Metascape ontology clusters highlighting the top enriched GO terms for differential gene expression common between that of MTZ/Control and CBE/Control (E) and that of MTZ+ olmesartan/MTZ and CBE+ olmesartan/CBE (F). The colors of the nodes correspond to significant values. The size of the nodes is proportional to the number of input genes in the GO term. The most significant GO terms in both (E) and (F) include oxidative phosphorylation, respiratory electron transport, ATP metabolic process, and inorganic cation transport.

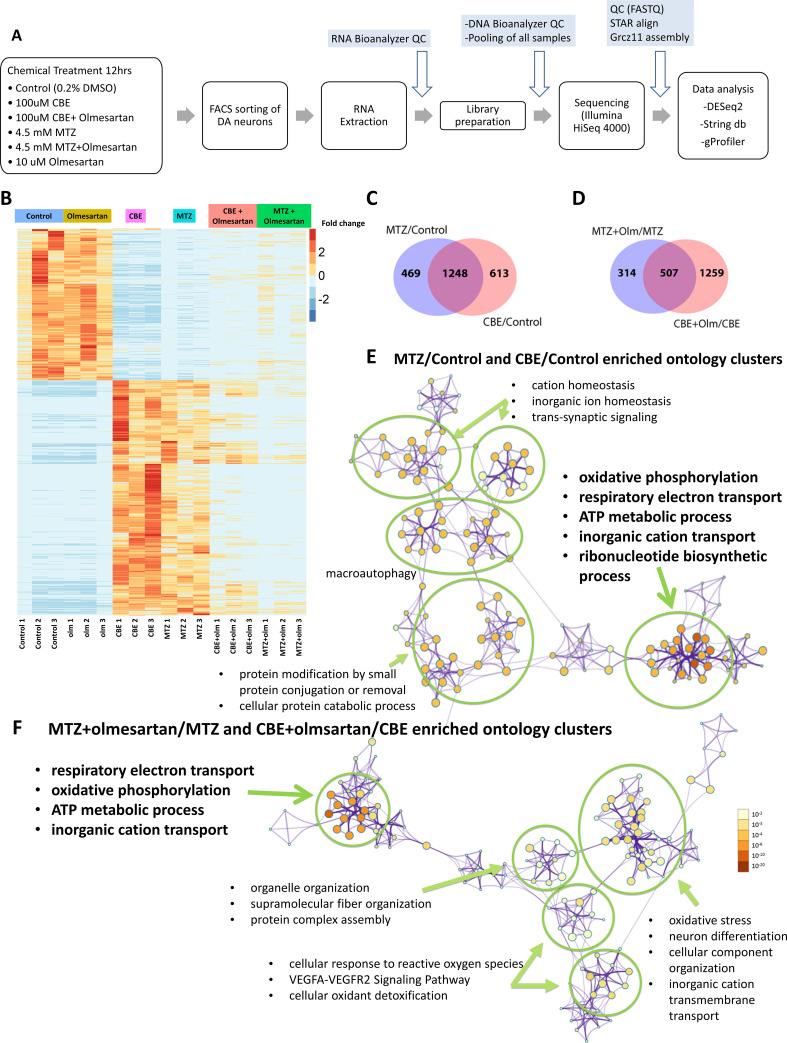
Figure 5—source data 1. DESeq2 output with RefSeq (GCF_000002035.6_GRCz11).
-CBE vs Control. -CBE+ olmesartan vs CBE. -CBE vs MTZ. -MTZ+ olmesartan vs MTZ.
Figure 5—source data 2. GO analysis.
-CBE/control vs MTZ/control annotations.-CBE/control vs MTZ/control pathway enrichment. -CBE+ olm/CBE vs MTZ+ olm/MTZ annotations. -CBE+ olm/CBE vs MTZ+ olm/MTZ pathway enrichment.
Figure 5—source data 3. Cytoscape file for GO analysis CBE/control vs MTZ/control.
Figure 5—source data 4. Cytoscape file for GO analysis CBE+ olm/CBE vs MTZ+ olm/MTZ.

Figure 5.

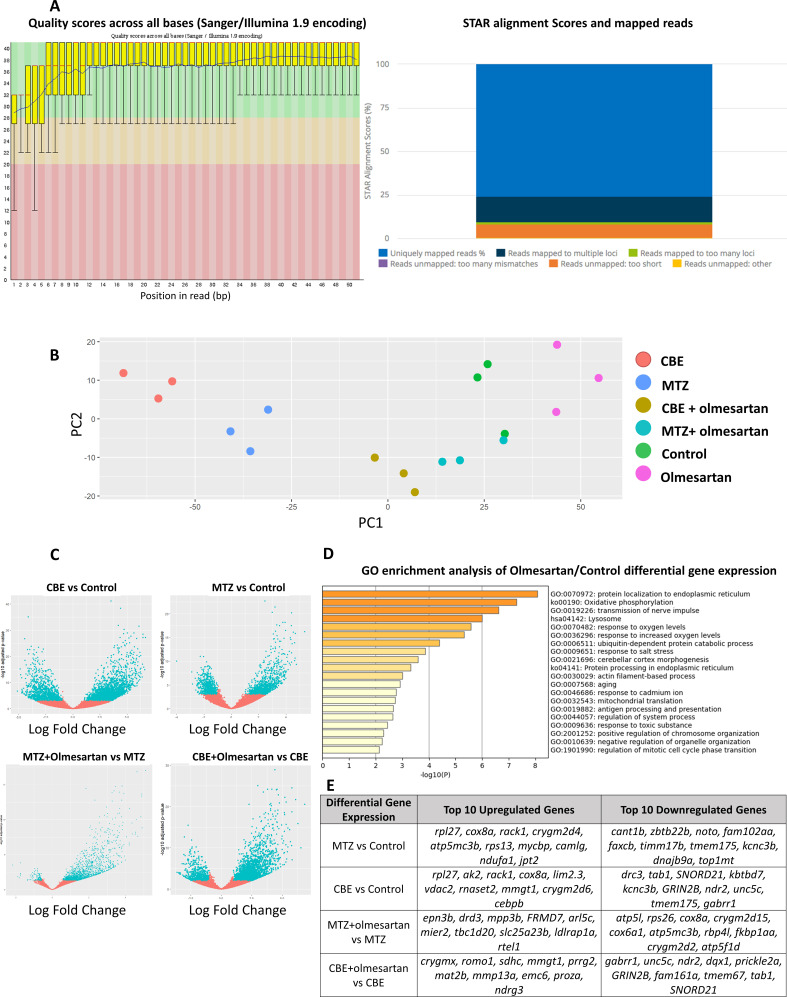
Figure 5—figure supplement 1. Quality control (QC) and pathway analysis of DA neuron-specific RNA-seq data.

Figure 5—figure supplement 1.

(A) Representative FastQC output of a CBE-treated sample. All samples underwent FastQC (https://www.bioinformatics.babraham.ac.uk/projects/fastqc/) for quality control. Mappings were aligned with the GRCz11 genome assembly and all samples showed greater than 75% uniquely mapped reads as the example. (B) The Principal Component Analysis (PCA) plot of the RNA-seq sample replicates shows that each sample group forms distinct clusters. (C) Volcano plots showing the differential gene expression comparing CBE vs control, MTZ vs control, MTZ+ olmesartan vs MTZ, and CBE+ olmesartan vs CBE. Log transformed adjusted p-values are plotted on the y-axis and log2 fold change values are plotted on the x-axis. (α = 0.05, FDR = 0.1; Wald test) (D) Pathway enrichment analysis of the differential gene set for olmesartan treatment compared to control using gProfiler. The top 20 pathways are shown. Thirteen additional pathways (not shown) also showed significance with Padj <0.05. (E) List of top 10 upregulated genes and downregulated genes under different conditions listed in the first column.