. 2021 Sep 22;10:e69795. doi: 10.7554/eLife.69795

Figure 7. Clinical data analysis uncovers delayed disease progression in PD patients on RAAS inhibitors.

(A) Flow chart showing the patient cohort studied in the PPMI data. Red circles indicate groups of patients on RAAS, not on RAAS, and on other anti-hypertension medications (HTN) used for the time to levodopa analysis. Green circles indicate the patient cohorts not on levodopa for 3+ years that were used for the UPDRS Part 1, 2, and 3 analyses. (B) Average time to levodopa therapy for de novo PD patients shows significant difference in patients taking RAAS inhibitors versus patients not on RAAS inhibitors (n = 96 and 212; p < 0.05, unpaired t-test) (C) Kaplan Meier survival curve showing the percentage of HTN patients free of levodopa over time for those on RAAS inhibitors versus on other anti-hypertensive medications. HTN patients on RAAS inhibitors showed greater percentage free of levodopa over time compared to patients on other HTN medications (n = 96 and 42; p < 0.05, Log-rank Mantel-cox test). (D) UPDRS Score part one shows significantly worsened (higher) scores for subsequent visits in the No RAAS group and the group using other anti-hypertensives compared to the group on RAAS inhibitors (n = 46, 24, and 103; p = 0.023, one-way ANOVA, post-hoc Tukey).

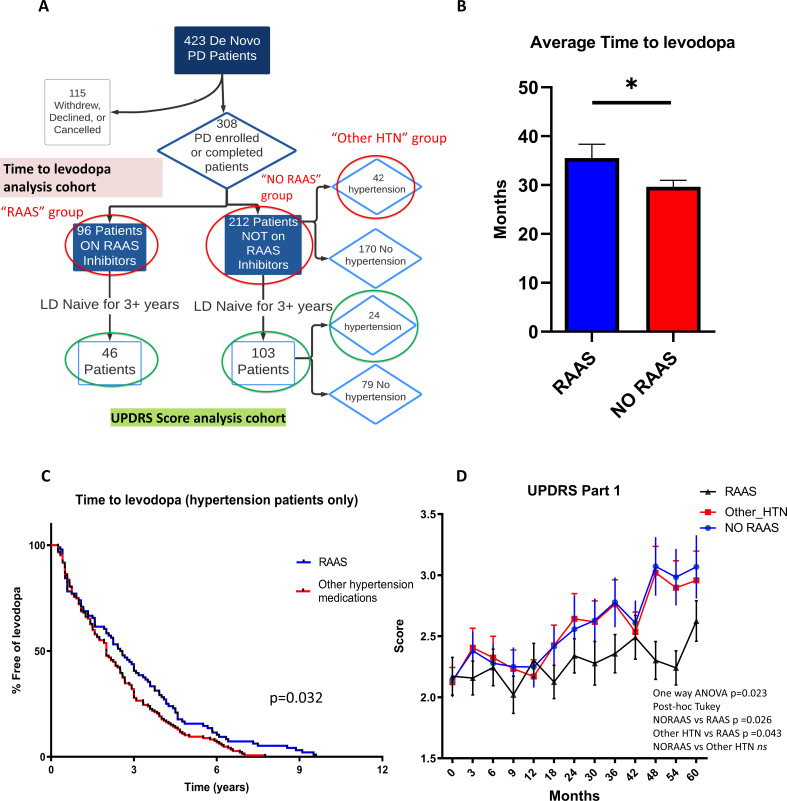
Figure 7—source data 1. Parkinson Progression Marker’s Initiative deidentified patient data for analysis.
Figure 7—source data 2. UPDRS Score analysis.
-RAAS vs No RAAS time to levodopa. -Part 1, 2, 3.
Figure 7—source data 3. R script for propensity score matching.
Figure 7—source data 4. PPMI Data and Publications Committee approval letter.

Figure 7.

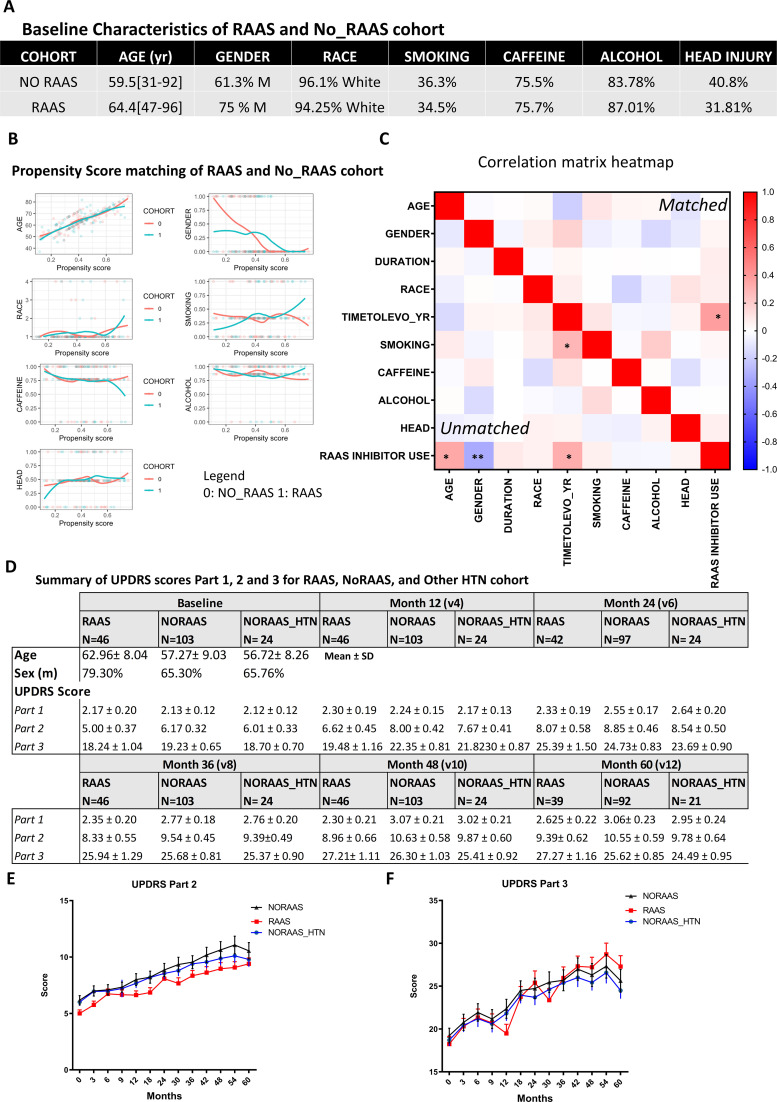
Figure 7—figure supplement 1. Patient cohorts from PPMI data, propensity score matching, and UPDRS Part2, Part3 analysis.

Figure 7—figure supplement 1.

(A) Baseline characteristics of the de novo PD patients on RAAS inhibitors and not on RAAS inhibitors. (B) Plots of the covariates against the estimated propensity score, separated by patients on RAAS inhibitors versus patients not on RAAS inhibitors. There was no significant difference in means upon matching (Welch two sample t-test; Age p = 0.98, Race p = 0.93, Gender p = 0.93, Caffeine intake p = 0.52, History of head injury p = 0.81, Smoking p = 0.84, Alcohol intake p = 0.91) (C) Pairwise Pearson correlation of the covariables including age, gender, duration of PD, race, time to levodopa, smoking status, caffeine, alcohol consumption, history of head injury, and RAAS inhibitor use. The lower left panel shows the correlation without matching and the upper right panel shows the correlation upon matching. Prior to matching, the RAAS cohort was significantly different in gender, age, and time to levodopa compared to the No RAAS group (*p < 0.05, **p < 0.01). Upon matching, the RAAS inhibitor use was significantly correlated with time to levodopa (*p < 0.05). (D) Mean UPDRS scores and standard deviation progression for the RAAS inhibitor, Non-RAAS, and other anti-hypertensive medication cohort starting from baseline to visit 12. (E) UPDRS part 2 and (F) part 3 progression showed no significant difference across the RAAS inhibitor, Non-RAAS, and other hypertension cohort. (n = 39–46 for RAAS cohort, n = 92–103 for No RAAS cohort, n = 21–24 for No RAAS_HTN cohort; Part 2 p = 0.53; Part 3 p = 0.85, one-way ANOVA).