Figure 6.
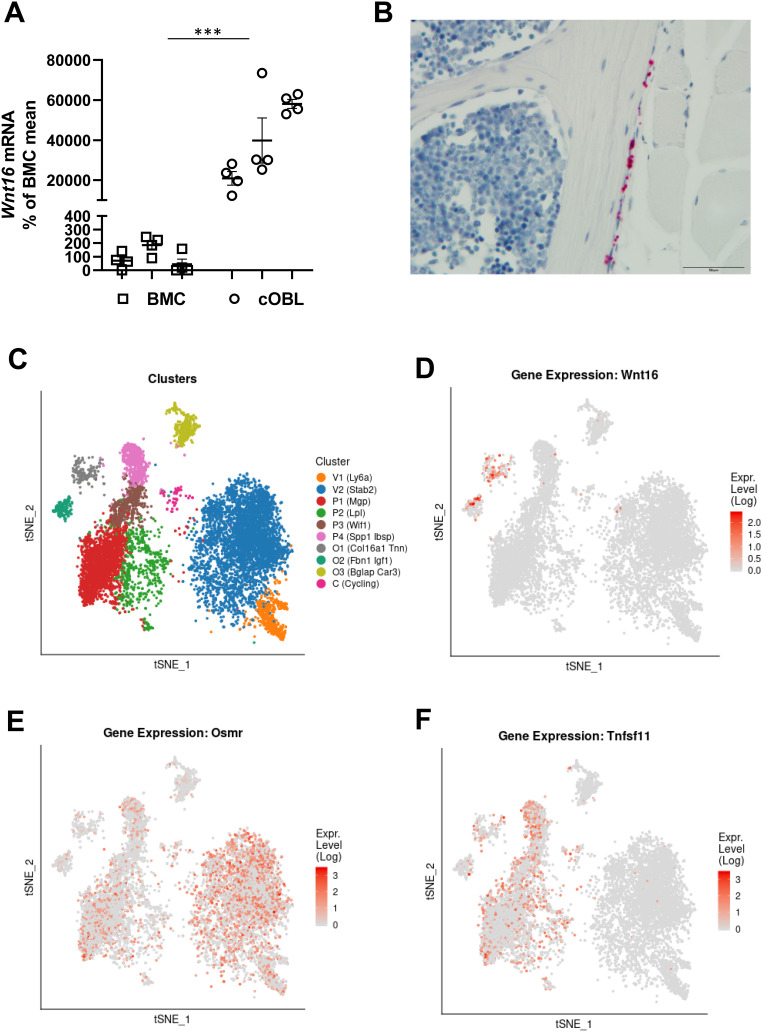
Expression of Wnt16 in calvarial bone cells and bone marrow cells analyzed by PCR, in situ hybridization and scRNAseq. (A) Expression of Wnt16 in three bone marrow cell (BMC) cultures and three calvarial bone cell (cOBL) cultures cultured in osteogenic media for 7 and 6–8 days, respectively. Individual values are presented with the mean shown as horizontal lines and ±SEM as vertical lines. ***P<0.001 BMC vs cOBL, two-way ANOVA. (B) RNAscope of Wnt16 expression (red) in L5 vertebrae. Scale bar, 50 µm. (C–F) Single cell RNA sequencing analysis of bone marrow stromal cells using nicheExplorer.52 Reprinted with permission from Springer Nature Customer Service Centre GmbH; Springer Nature; Nature; The bone marrow microenvironment at single-cell resolution, Anastasia N. Tikhonova et al, © 2019, www.aifantislab.com/niche. (C) t-SNE visualization of endothelial (V1-2), perivascular (P1-4), osteo-lineage (O1-3) and one mitotic cell cluster (cycling) identified by Tikhovona et al.52 Feature plots of Wnt16 (D), Osmr (E) and Tnfsf11 (F) expression.

