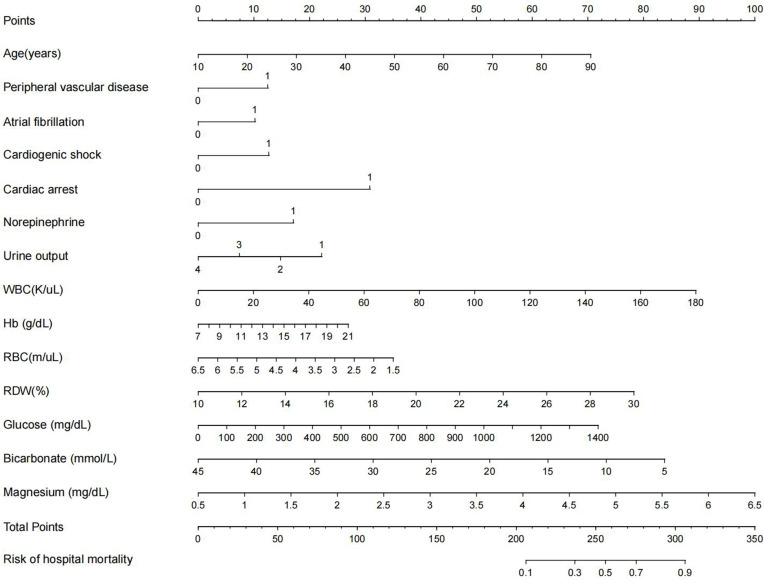
Figure 2.
Nomogram for predicting the risk of hospital mortality in AMI patients admitted in ICU. To use this nomogram, first, locate the patient’s age, then draw a vertical line straight up to the points axis on the top to get the score associated with age. Repeat the process for the other variables. Add the score of each variable together and locate the total score on the total points axis. Finally, draw a line straight down to the “risk of hospital mortality” axis at the bottom to obtain the probability of hospital mortality. Urine: 1: <100mL; 2: ≥100mL and <400mL; 3: ≥400mL and <2500mL; 4: >2500mL.

