Figure 3.
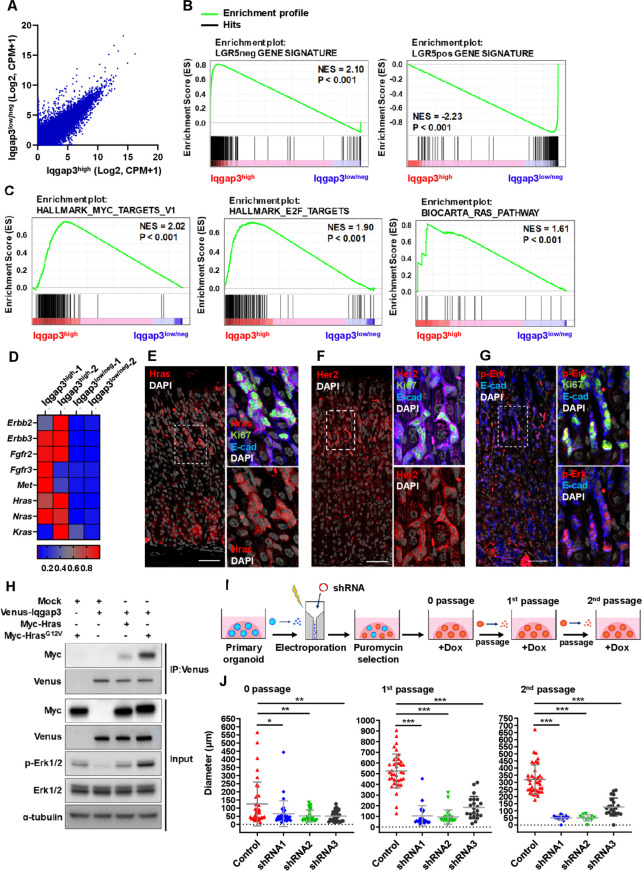
Iqgap3 regulates stem cell proliferation via Ras-ERK pathway. (A) Average of RNA expressions in sorted Iqgap3high and Iqgap3low/neg cell fractions are shown. (B) Gene set enrichment analysis (GSEA) showing enrichment of Lgr5-negative (LGR5neg) and—high (LGR5pos) corpus epithelial cell gene signature from public datasets (GSE86603) in Iqgap3high and Iqgap3low/neg cell fractions. P values determined by a weighted Kolmogorov–Smirnov-like statistic and adjusted for multiple hypothesis testing. (C) GSEA showing enrichment of Myc target gene signature, E2F targets gene signature, Ras pathway gene signature in Iqgap3high and Iqgap3low/neg cell fractions. (D) Heat MAP showing expression of representative Ras-ERK pathway genes in Iqgap3high and Iqgap3low/neg cell fractions. Gene expression levels are shown in Z-score of CPM of RNA-sequencing. (E–G) IF staining for HRAS, Ki67, E-cad, HER2 and phosphorylated ERK (p-Erk) on the corpus of wild-type (WT) mice (n=3). (H) Immunoprecipitation for the interaction of Venus-tagged Iqgap3 (Venus-Iqgap3) with Myc-tagged HRAS (Myc-Hras) or Myc-tagged HrasG12V (Myc-HrasG12V) and immunoblot for cell lysate from Venus-Iqgap3/Myc-Hras/Myc-HrasG12V expressed 293 T cells. (I) Experimental strategy to suppress Iqgap3 expression by shRNA in organoids from WT mice. (J) Quantification of size of Iqgap3 knockdown organoids from 0 passage (6 day post doxycycline (Dox) treatment, before passage), first passage (8 days postpassage) and second passage (7 days postpassage) (n=2). Error bars represent SD from each population. Data sets were analysed by one-way ANOVA. Scale bar=100 µm. ANOVA, analysis of variance; CPM, counts per million; ERK, extracellular signal-regulated kinase; NES, normalised enrichment score.

