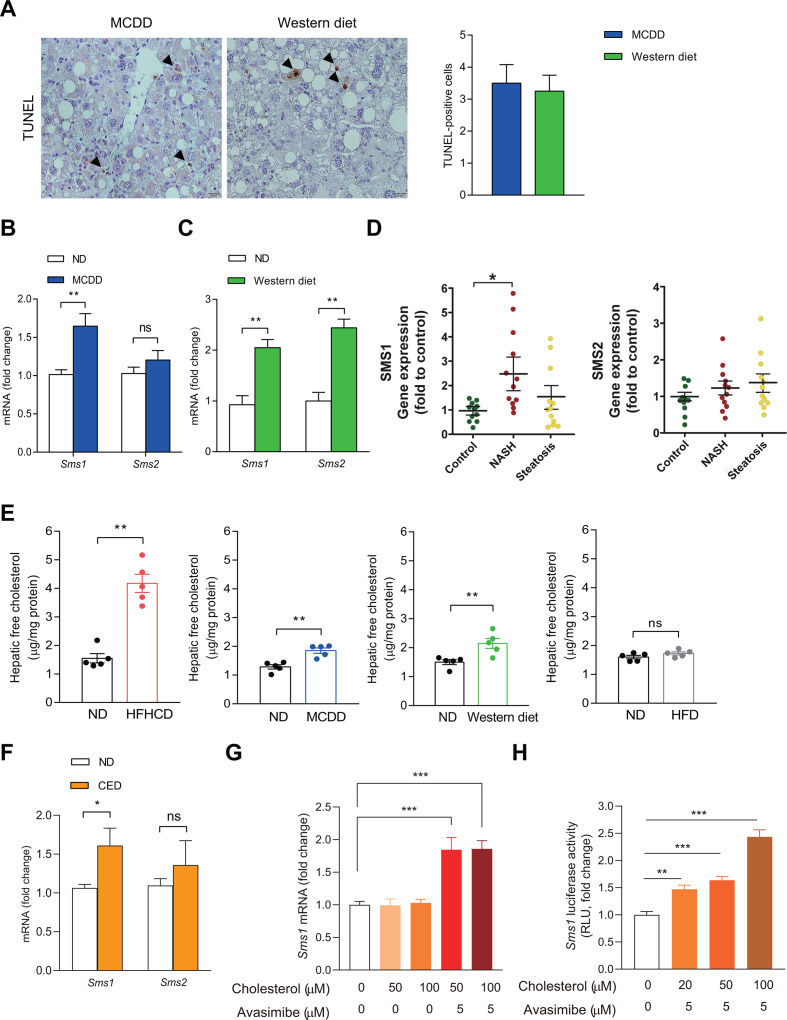
Figure 2.
FC induces Sms1 expression in hepatocytes. (A) TUNEL staining in the liver sections following MCDD (8 weeks) or Western diet (16 weeks). Arrowheads show TUNEL positive hepatocytes, which are quantitated in the graph. Scale bar, 20 µm. (B, C) mRNA expression of Sms1 and Sms2 in the livers of mice fed MCDD (B) or Western diet (C) (n=7). (D) Hepatic mRNA expression of SMS1 and SMS2 in liver samples of patients with NASH/cirrhosis and subjects with steatosis (n=12). Surgical specimens of donor livers were used as controls (n=11). (E) Hepatic FC levels of mice fed ND, HFHCD, MCDD, Western diet or HFD (n=5). (F) mRNA expression of Sms1 and Sms2 in the livers of mice fed ND or CED for 2 days (n=7). (G) AML12 cells were treated with cholesterol with Avasimibe for 2 hours at the indicated dose to determine Sms1 mRNA expression (n=4). (H) AML12 cells were transfected with mouse Sms1 promoter-Luc to determine Sms1 transcriptional activity. After 48 hours of transfection, cells were treated with vehicle or cholesterol with Avasimibe for 3 hours (n=6). Data are presented as mean±SEM *p< 0.05, **p<0.01 and ***p<0.001 vs control. CED, cholesterol-enriched diet; FC, free cholesterol; HFD, high fat diet; HFHCD, high fat, high cholesterol diet; MCDD, methionine and choline-deficient diet; ns, not significant; TUNEL, terminal deoxynucleotidyl transferase-mediated dUTP nick‐end labelling.

