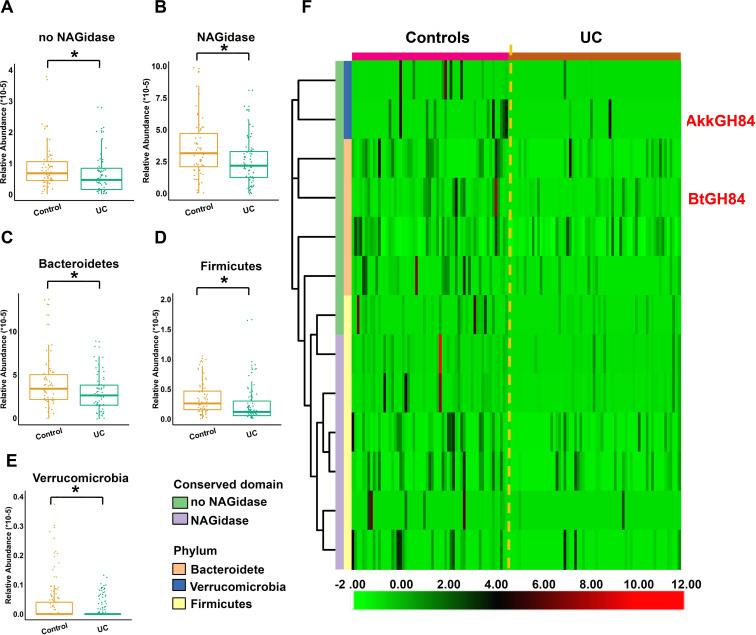
Figure 3.
Detail of the abundance of OGA-encoding genes in UC. (A, B) Gene abundance of OGAs with or without NAGidase domain in controls and UC. (C–E) Abundance of OGA-encoding genes from different phylum in controls and UC. (F) Heatmap of OGA-encoding genes with significantly different abundance between controls and UC. P values were computed by Manne-Whitney U test and corrected by false discovery rate, *P<0.05. OGA, O-GlcNAcase; UC, ulcerative colitis.

