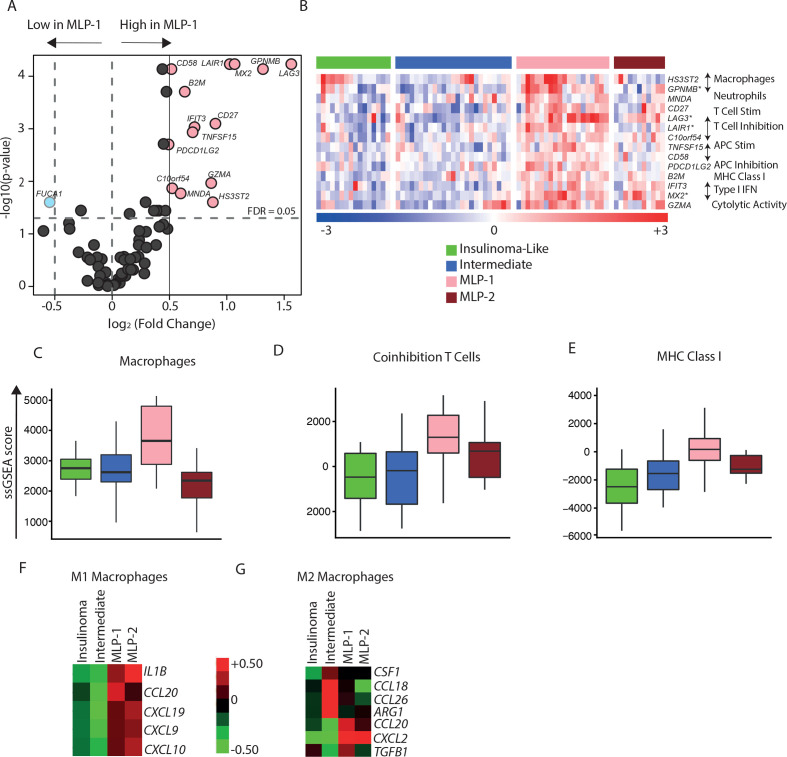
Figure 4.
Immune cell type landscape in PanNET subtypes. (A) Differential expression of immune cell type-specific genes in MLP-1 versus other subtypes. FDR values were computed on the training cohort based on t-test. Pink dots highlight 14 overexpressed genes in MLP-1 subtype (fold change≥1, FDR<0.05). (B) Heatmap of the 14 overexpressed immune cell type-specific genes across the four PanNET subtypes. Genes with a fold change >2 are highlighted (*). The immune cell types associated with the specific genes are displayed on the right. Top bar represents PanNET subtypes. In the rainbow bar below the heatmap, red indicates elevated expression; blue indicates decreased; and white indicates no change. (C–E) Enrichment scores (ssGSEA) of immune cell type-specific gene sets, namely,(C) macrophages, (D) coinhibition T cells, and (E) MHC class I across PanNET subtypes (FDR<0.05 based on Kruskal-Wallis test). (F, G) Heatmaps showing median expression of genes associated with (F) M1 and (G) M2 macrophages across PanNET subtypes in the training cohort. Red indicates elevated expression; green indicates decreased expression; and black indicates no change. FDR, false discovery rate; IFN, interferon; MHC, major histocompatibility complex; MLP, metastasis-like primary; PanNET, pancreatic neuroendocrine tumour; ssGSEA, single-sample gene set enrichment analysis.

