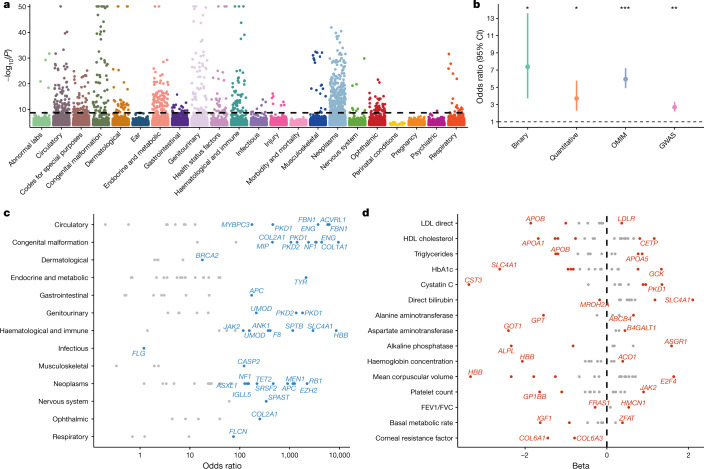
Fig. 2. Summary of gene-level collapsing analysis results.
a, Gene–phenotype associations for binary traits. For gene–phenotype associations that appear in multiple collapsing models, we display only the association with the strongest effect size. The dashed line represents the genome-wide significant P value threshold (2 × 10⁻⁹). The y axis is capped at −log10(P) = 50 and only associations with P < 10−5 were plotted (n = 94,208). b, Enrichment of FDA-approved drug targets6,46 among significant binary traits, quantitative traits, OMIM genes and GWAS signals. P values were generated via two-sided Fisher’s exact test (*P < 10−5, **P < 10−20, ***P < 10−70). Exact statistics: binary odds ratio (OR) = 7.38, 95% CI: 3.71–13.59, P = 1.5 × 10⁻⁷; quantitative OR = 3.71, 95% CI: 2.28–5.76, P = 4.5 × 10⁻⁷; OMIM OR = 5.95, 95% CI: 4.90–7.23, P = 1.1 × 10−75; GWAS OR = 2.68, 95% CI: 2.12–3.32, P = 3.6 × 10⁻²³). Error bars represent 95% CIs. Contingency tables were created using each of the binary (n = 195), quantitative (n = 395), OMIM (n = 3,875) and GWAS (n = 10,692) categories, alongside approved targets from Informa Pharmaprojects (n = 463). P values were generated via a two-tailed Fisher’s exact test. c, Effect sizes for select gene associations per disease area. Genes with the highest OR for a chapter or with OR > 100 are labelled. d, Illustration of large effect gene–phenotype associations for select disease-related quantitative traits. FEV1/FVC, forced expiratory volume in 1 s/forced vital capacity ratio; HDL, high-density lipoprotein; LDL, low-density lipoprotein. Dashed line corresponds to a beta of 0.

