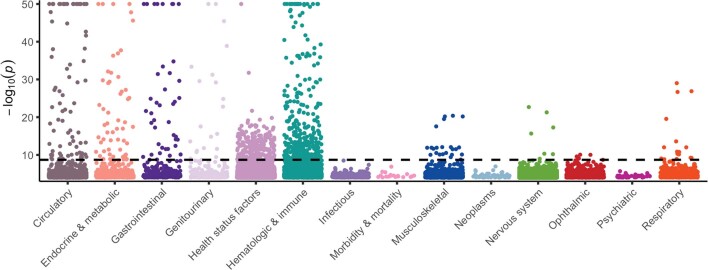
Extended Data Fig. 3. Quantitative trait collapsing analysis.
Plot depicting significant gene-phenotype associations for quantitative traits. For gene–phenotype associations that appear in multiple collapsing models, we display only the association with the strongest effect size. The dashed line represents the genome-wide significant p-value threshold (2 × 10⁻⁹). The plot is capped at -log10(P) = 50 and only associations with P < 10-5 are included (n = 22,549).

