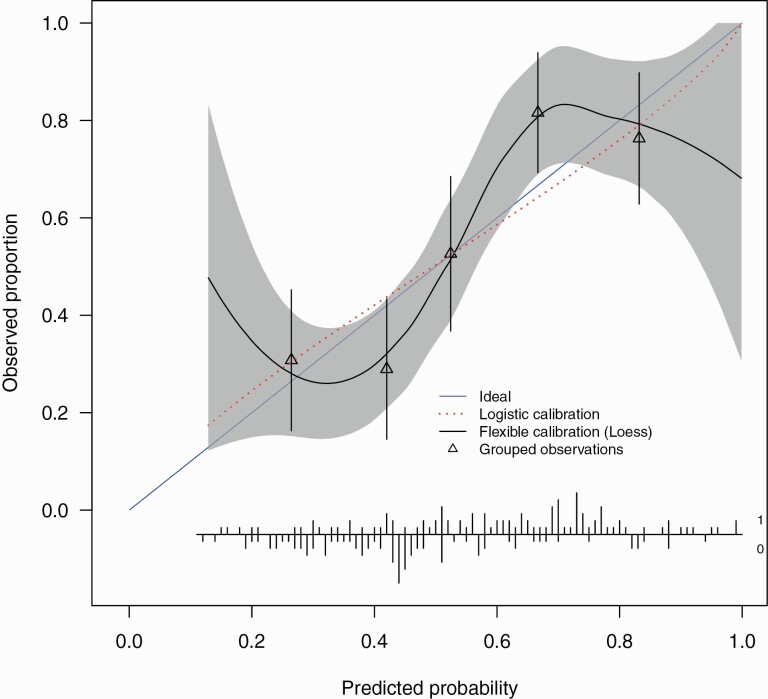
Fig. 2.
External validation calibration plot. The calibration intercept of -0.014 (-0.34, 0.31) and slope 0.85 (0.42, 1.27). Triangles represent quintiles of subjects grouped by similar predicted risk. The distribution of subjects is indicated with spikes at the bottom of the graph, stratified by endpoint (nonremitters above the x-axis, remitters below the x-axis). Although both sets of confidence intervals overlapped the ideal values, the calibration slope point estimate is smaller than 1 indicating that the predicted risks were too extreme in the sense of overestimating for patients at high risk while underestimating for patients at low risk and is indicative of overfitting of the model. The calibration intercept point estimate was close to ideal suggesting no general over- or underestimation of predicted risks.

