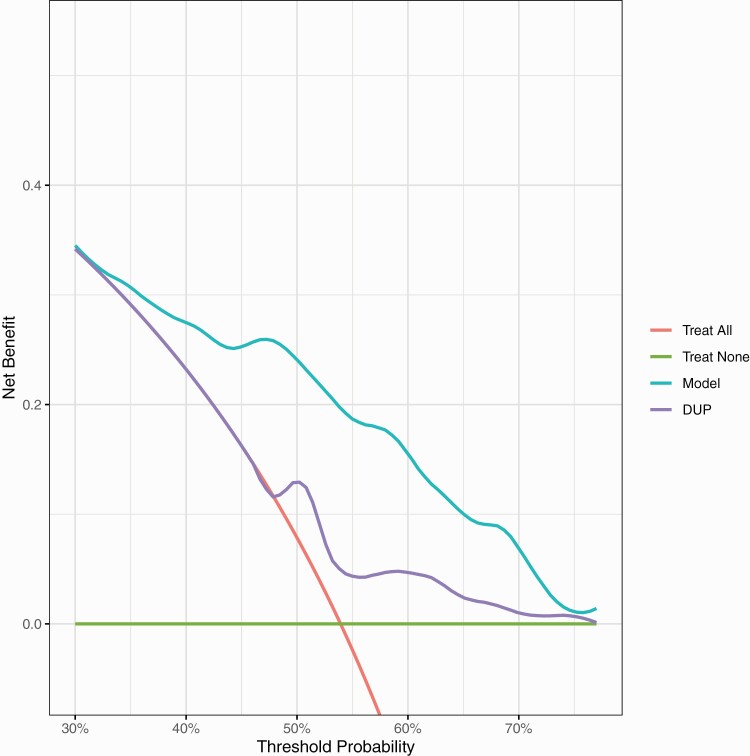
Fig. 3.
External validation decision curve analysis plot. Net-benefit is the treatment threshold weighted sum of true- minus false-positive classifications for each strategy plotted against an entire range of treatment thresholds. Green line: no patients are treated, net-benefit is zero (no true-positive and no false-positive classifications); red line: all patients are treated; purple and cyan lines: patients are treated if predictions exceed a threshold, with nonremission predictions based on adjusted DUP only, or on our prediction model. Between thresholds of 35% to 70%, treating based on our model is better than treating all, treating none or treating using DUP alone.

