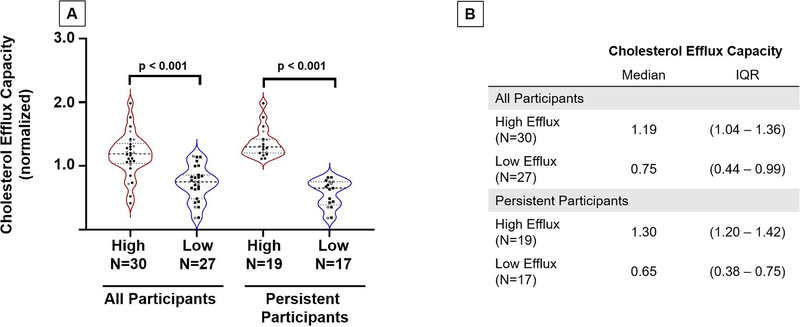
Figure 2: Cholesterol efflux capacity of recruited participants 15–18 years after baseline enrollment.
Panel A. Cholesterol efflux of participants at follow-up visit (2016–2020) n=57; 30 high efflux group, 27 low efflux group. Of those recruited, we narrowed down our list to those who remained persistent over time (at least two-fold difference). Efflux was normalized to a human ApoA-I protein standard at a concentration of 50ug/mL. Men are represented by open circles, and women by closed circles.
Panel B. Table with median cholesterol efflux values along with IQR for each group (high vs. low) obtained at follow-up visit

