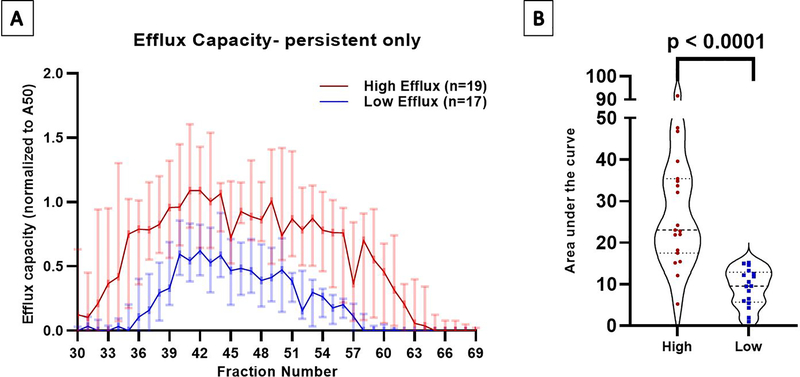
Figure 3: Cholesterol efflux capacity in fractionated plasma after size exclusion chromatography.
Panel A. Efflux elicited by eluting fractions 30–69 from apoB-depleted plasma separated using Superose 6 increase SE column. High efflux participants are represented in red and low efflux group in blue. Data plotted are median values for each fraction with 95% confidence intervals. Efflux values were significantly different (p≤0.05) for every fraction except #31, #45, and #62–69.
Panel B. Statistical comparison of total area under the curve. Whiskers depict standard error of the area.

