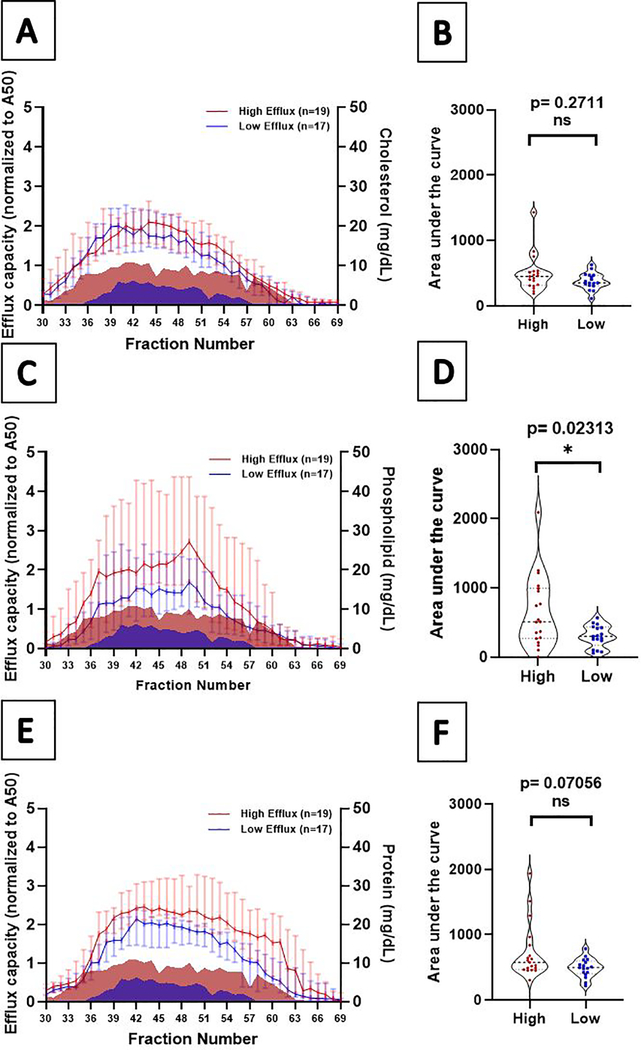
Figure 4: Fraction-specific Cholesterol, Phospholipid, and Total Protein in Persistent High and Low Cholesterol Efflux.
Panels A, C, and E: Total cholesterol, phospholipid, and protein by eluting fractions 30–69 from apoB-depleted plasma separated using Superose 6 increase SE column. Persistent high efflux participants are represented in red and persistent low efflux group are represented in blue. Median values for each fraction are displayed with 95% confidence intervals. Mountain plots represent cholesterol efflux for comparison. Panels B, D, and F: Total area under the curve for the fraction-specific values (whiskers depict standard error of the area).

