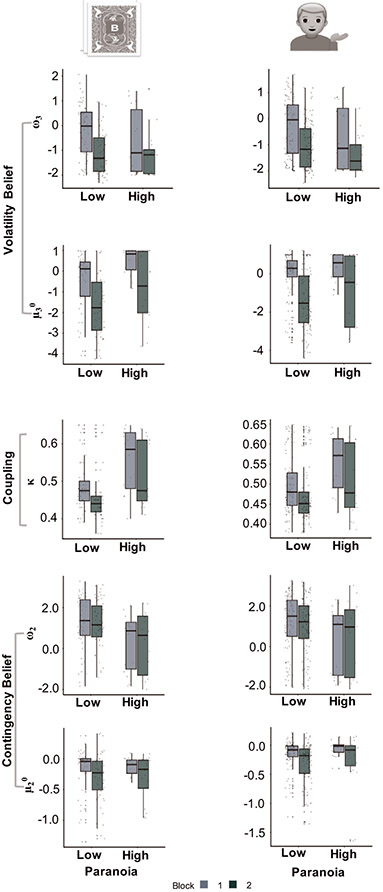
Figure 2. Pre-pandemic (N=202) social and non-social reversal learning.
a, non-social and social task stimuli and reward contingency schedule. b, in both non-social (n=72) and social (n=130) tasks, high paranoia subjects exhibit elevated priors for volatility (μ30; group: F(1, 198)=8.566, p=0.004, ηp2=0.035; block: F(1, 198)=161.845, p < 0.001, ηp2=0.11) and contingency (μ20; block: F(1, 198)=36.58, p < 0.001, ηp2=0.042), were slower to update those beliefs (ω2; group: F(1, 198)=12.986, p < 0.001, ηp2=0.053, ω3; group: F(1, 198)=4.447, p=0.036, ηp2=0.014, block: F(1, 198)=38.89, p < 0.001, ηp2=0.064), and had higher coupling (κ group: F(1, 198)=21.45, p < 0.001, ηp2=0.08, block: F(1, 198)=30.281, p < 0.001, ηp2=0.031) between volatility and contingency beliefs. c, 3-level HGF perceptual model (gray) with a softmax decision model (green). Level 1 (x1): trial-by-trial perception of win or loss feedback. Level 2 (x2): stimulus-outcome associations (i.e., deck values). Level 3 (x3): perception of the overall reward contingency context. The impact of phasic volatility upon x2 is captured by κ (i.e., coupling). Tonic volatility modulates x3 and x2 via ω3 and ω2, respectively. μ30 is the initial value of the third level volatility belief. Box-plots: Centre lines show the medians; box limits indicate the 25th and 75th percentiles; whiskers extend 1.5 times the interquartile range from the 25th and 75th percentiles, outliers are represented by dots; crosses represent sample means; data points are plotted as open circles.

