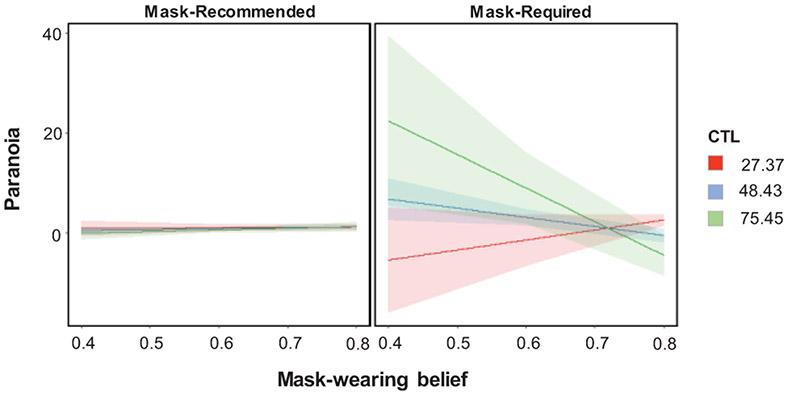
Figure 6. Predicting paranoia from pandemic features.
Regression model predictions (N=172) in states where masks were recommended (Left Panel) versus mandated (right panel). Paranoia predictions based on estimated state mask-wearing (x-axis, low mask-wearing to high mask-wearing) and cultural tightness. Red – Loose states, that do not prize conformity, Blue - states with median tightness, Green – tight states that are conservative and rule-following. Paranoia is highest when mask wearing is low, in culturally tight states with a mask-wearing mandate (F(11,160)=1.91,p=0.04). Values represent high, median, and low estimated state tightness.

