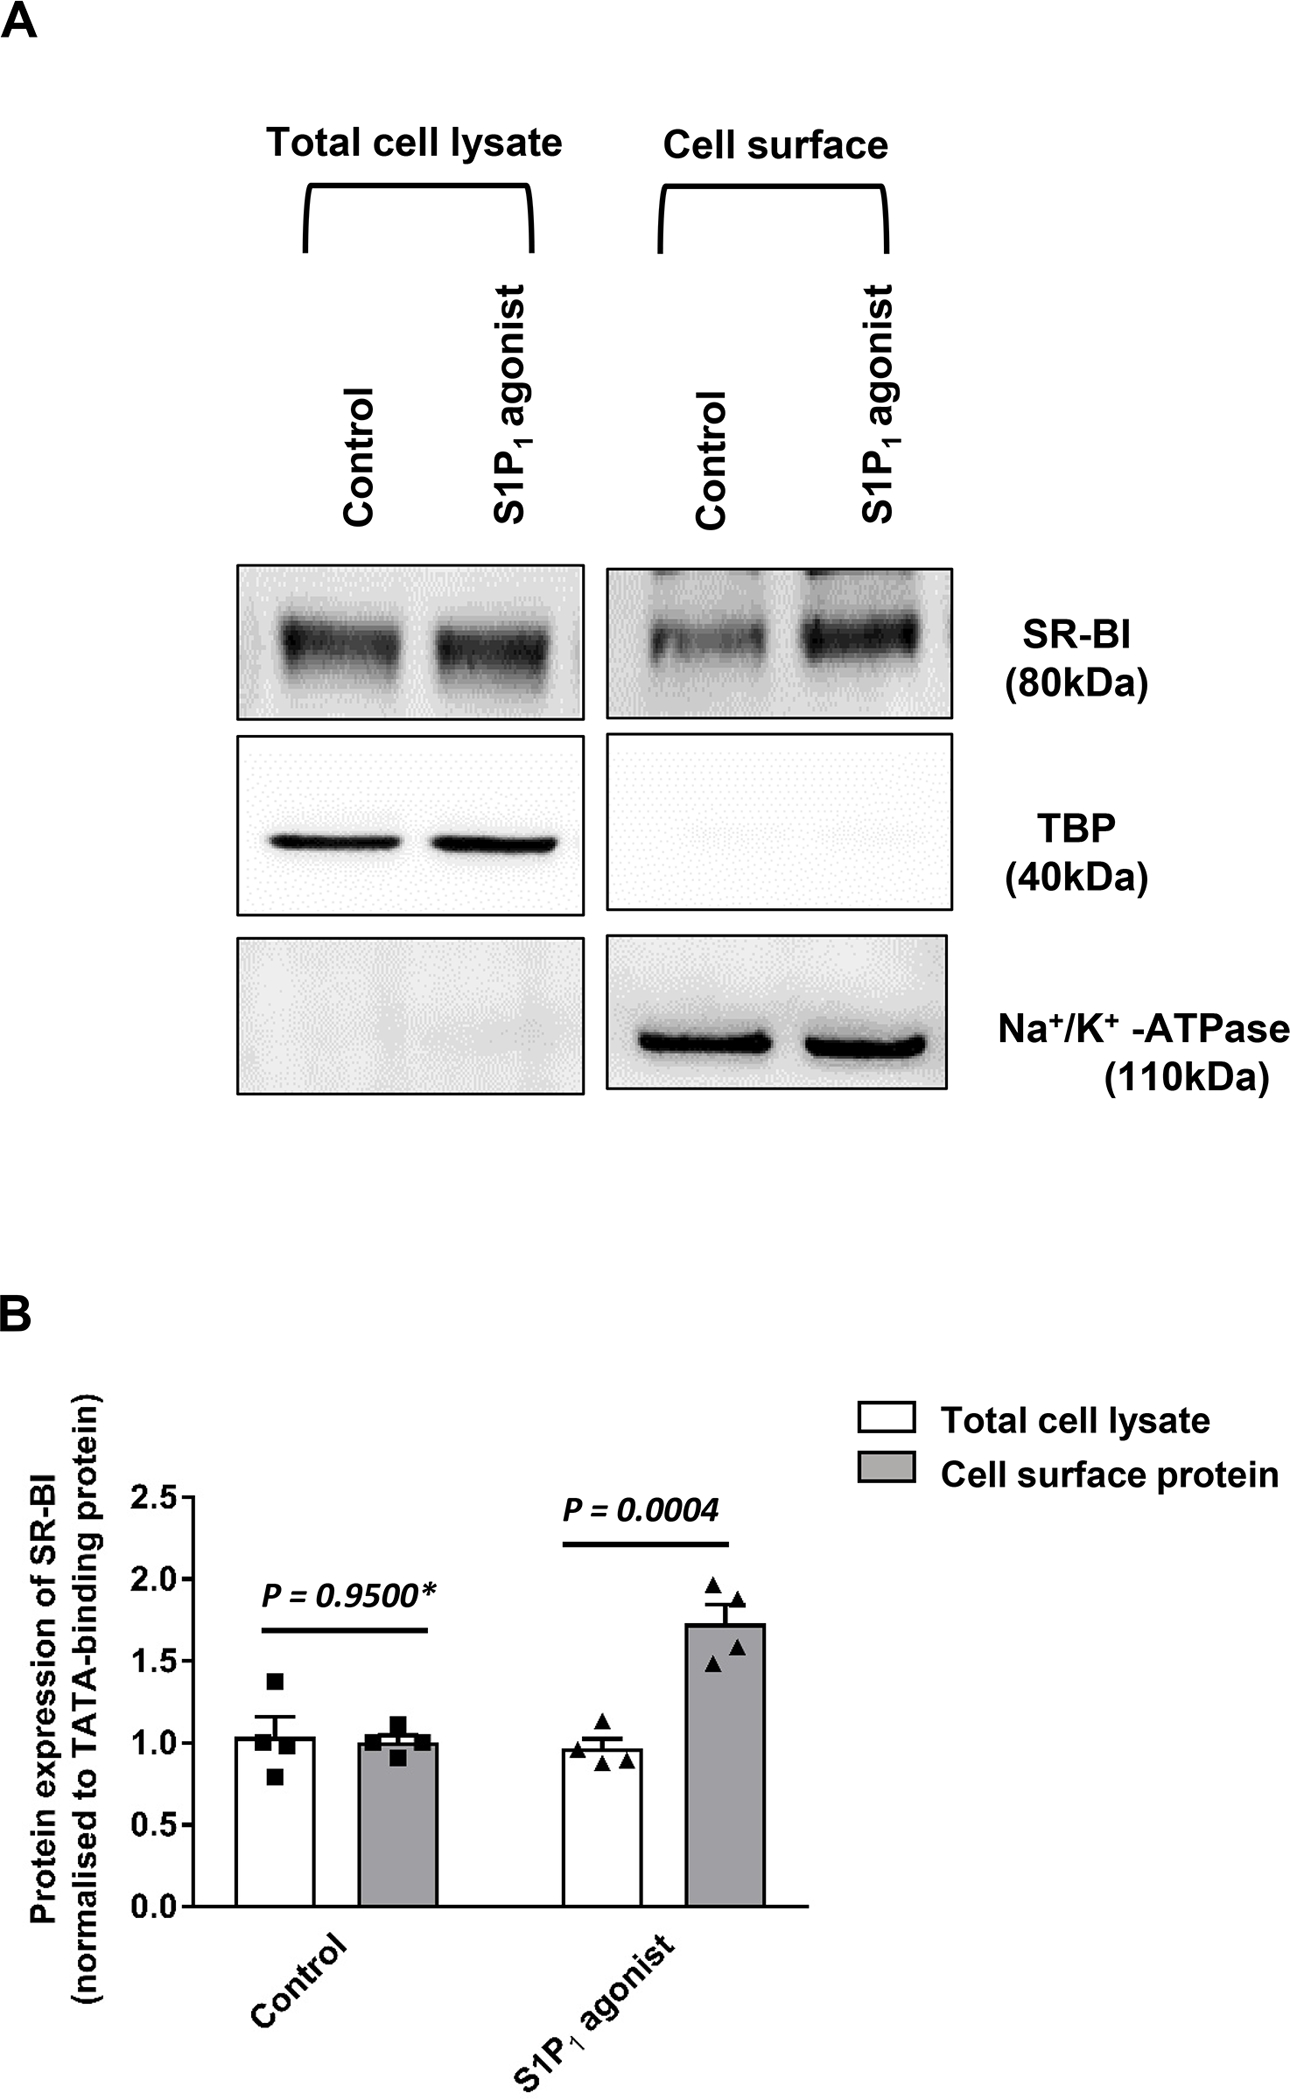
Figure 5: Effects of S1P1 activation on the cell surface abundance of SR-BI.

HAECs were cultured for 72 hours. Cells were then treated with 20nM SEW2871 for 30 minutes at 37 °C. Cell surface expression of SR-BI in HAECs was measured using Western blot analysis in total cell lysates (left) and on the cell surface (right). The western blots were probed with anti-SR-BI (82kDa), anti-TBP (40kDa, used as a control for intracellular protein expression) and Na+/K+-ATPase (110 kDa, used as a loading control for cell surface protein expression). (A) shows a representative western blot. (B) shows the summary of four independent experiments quantified by densitometry. P was calculated by unpaired Mann Whitney U-test.
