
Figure 1: Enrollment flow diagram for the Sex-Associated Differences in Physical Frailty Phenotypes in Heart Failure study.
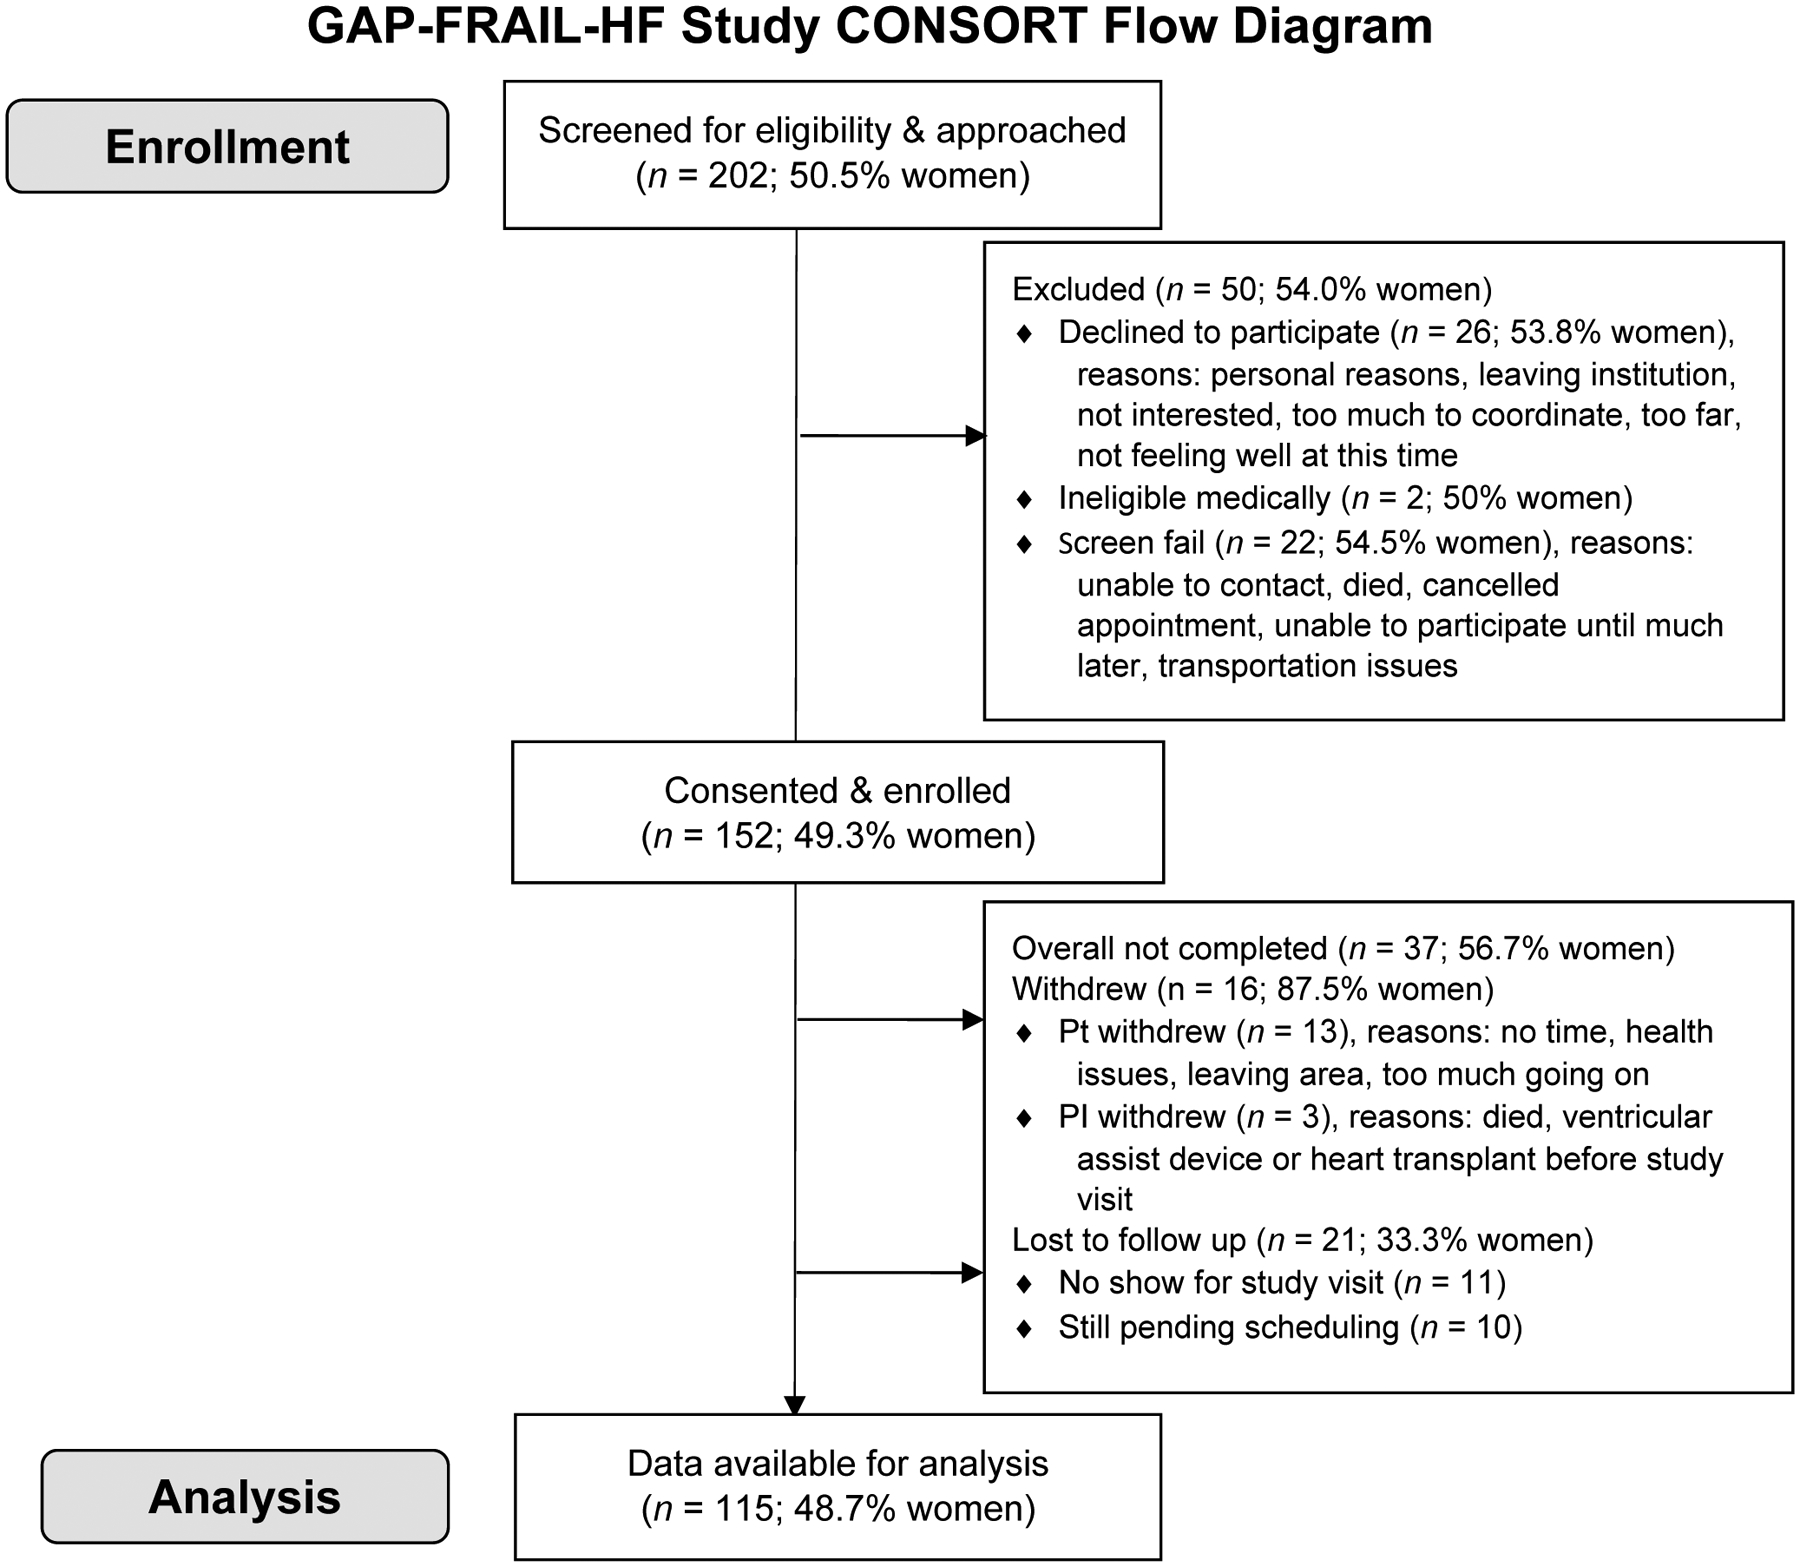
We screened and approached 202 adults for our study, 152 adults were enrolled, and 115 adults completed the baseline study visit and were analyzed. Overall, the balance between women and men remained about the same (~1:1); however, more women than men withdrew from the study after consent, but fewer women were lost to follow-up.