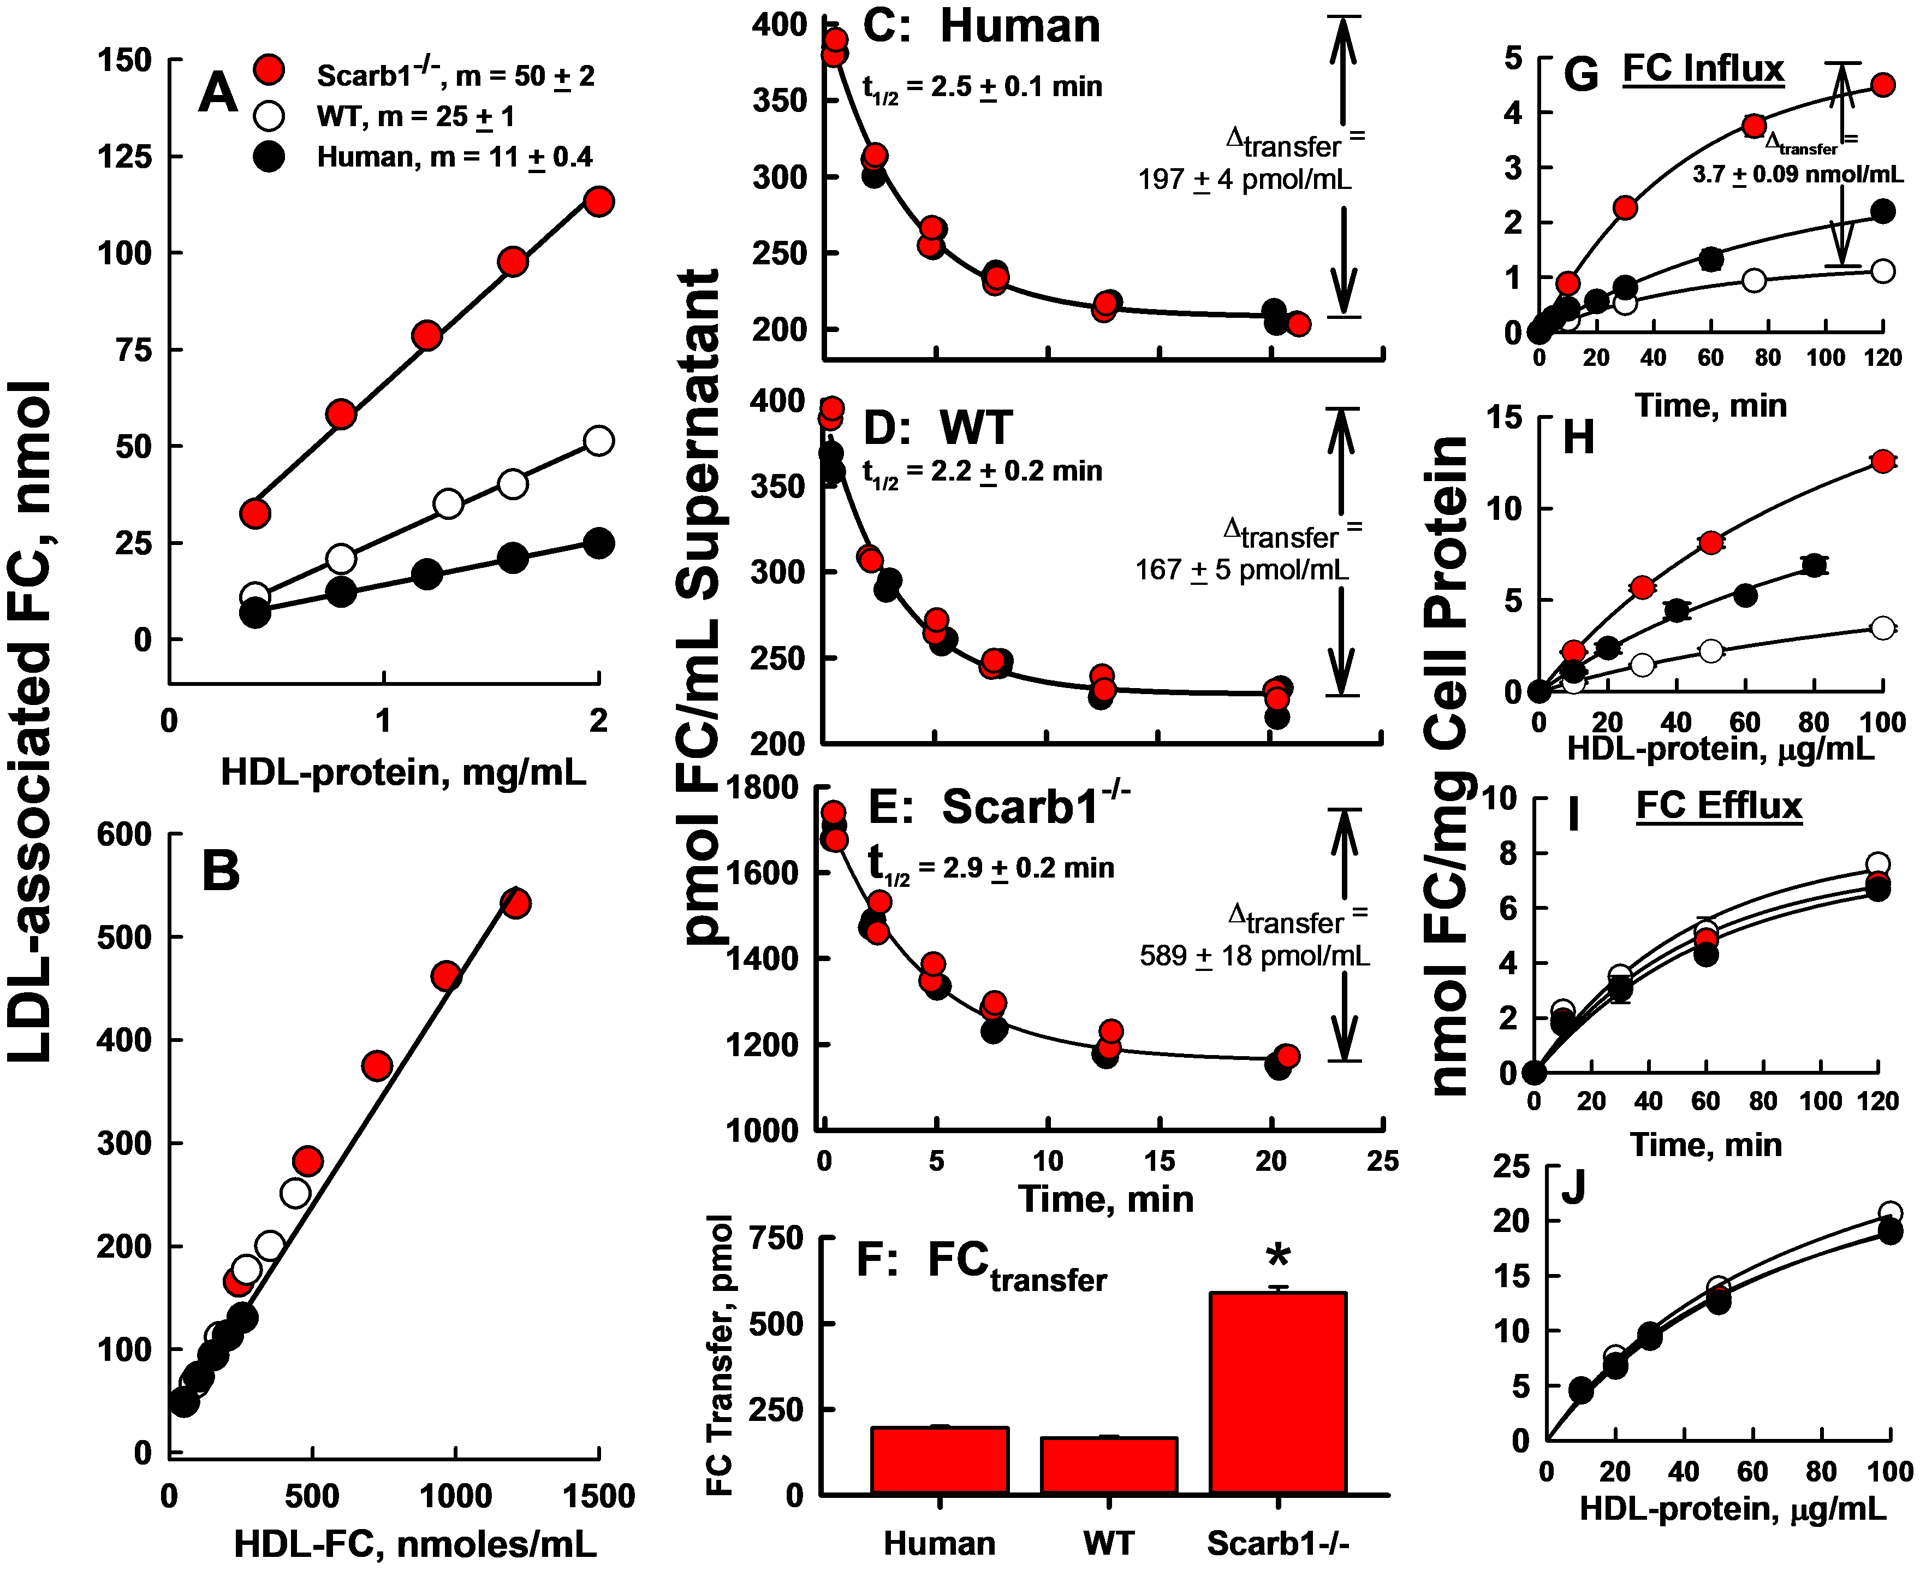
Figure 2:

HDL-FC Transfer to human LDL and J774 Macrophages. A, B: Equilibrium distribution of [3H]FC between various HDL and human LDL according to HDL-protein (A) and HDL-FC (B). The specific activities of WT mouse, Scarb1−/− mouse and human HDL-FC were 21,488, 7,942, and 38,233 dpm/nmol FC respectively. In A, m, the slopes of the linear regression lines, are different, p ≤ 0.0001 for all three curves. In B, where transfer is plotted vs. starting HDL-FC, data for the three HDL fall on a single line. C–E: Kinetics of HDL-[3H]FC Transfer to human LDL as labeled. The red and black symbols are from two independent experiments, and the lines are exponential decay fits of the combined data, as described in Methods. F: Extent of FC transfer from HDL to LDL at the asymptote, i.e., kinetic equilibrium, calculated from C–E. FC transferred from Scarb1−/− HDL > WT HDL (p < 0.0001). G–J: FC Flux between HDL and J774 Macrophages. G, H: FC influx from HDL to macrophages according to time (G) at 20 μg HDL-protein/mL and dose at 2 h (H). [3H]FC specific radioactivities were 40,767, 9,242 and 15,247 dpm/nmol FC respectively for human, WT, and Scarb1−/− HDL. At all times and doses, FC influx from SCARB1−/− HDL > WT HDL (p<0.0001). I, J: FC efflux from macrophages to HDL, time course (I; 20 μg HDL-protein/mL) and dose response (2 h; J). The plots are representative of two to three independent experiments, each done in triplicate. The points are mean ± SD with error bars sometimes smaller than the symbols.
