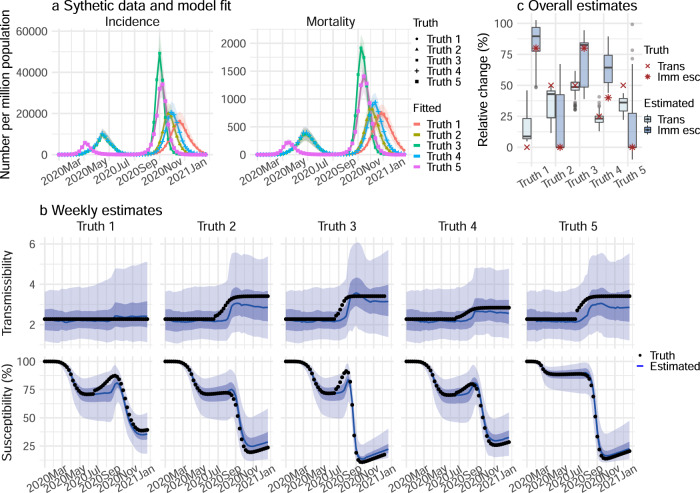
Fig. 1. Model-inference system validation using model-generated synthetic data with an infection-detection rate of 20%.
For this testing, the true values of incidence and mortality by week (a), transmissibility by week (b, top panel), population susceptibility by week (b, bottom), and overall changes in transmissibility and immune escape due to a new variant (c) were generated by model simulations with prescribed parameters and conditions. Unlike the real world, in which most epidemiological characteristics are unobserved, here these quantities (i.e., the “Truth”) are prescribed and known and thus can be compared to estimates made with the model-inference system using the synthetic, model-generated incidence and mortality data (a). a Five sets of synthetic data (dots) and model-fits to each data set; lines show mean estimates and surrounding areas show 50% (dark) and 95% (light) CrIs. b Weekly model-estimated transmissibility and population susceptibility. The lines show mean estimates and surrounding areas show 50% (dark) and 95% (light) CrIs, compared to the true values (dots). c overall estimates of the change in transmissibility (Trans) and immune escape (Imm esc), compared to the true values (dots); boxes show model-estimated median (middle bar) and interquartile range (box edges), and whiskers show model-estimated 95% CIs, from n = 100 model-inference simulations.

