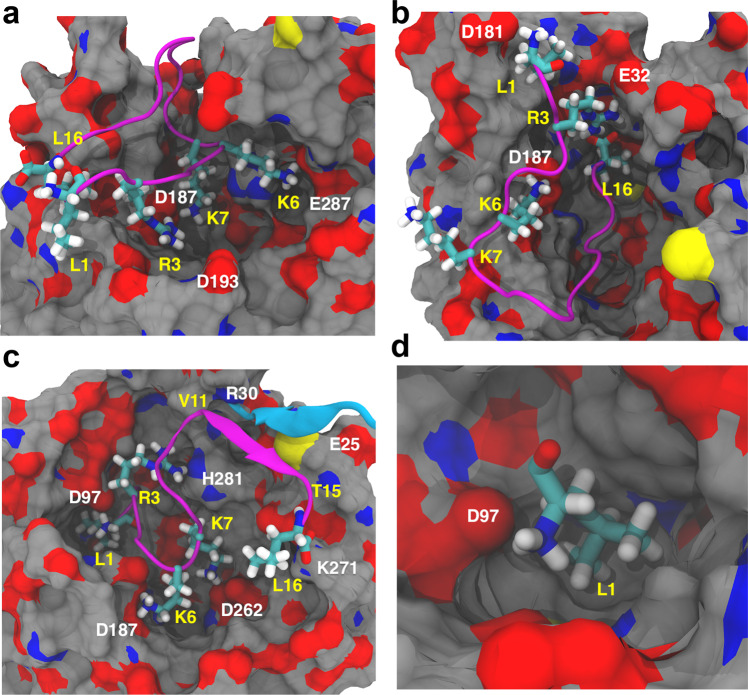
Fig. 3. Analysis of the interactions between CXCR4 and EPI-X4 in the MD simulations.
Binding modes MID-IN1 (a), CTER-IN (b), and NTER-IN (c, d) were identified from the clustering analysis. CXCR4 is represented as surface (carbon = gray, oxygen = red, and nitrogen = blue) and EPI-X4 is shown in cartoon diagram (purple). Important residues of EPI-X4 are shown as sticks and labeled in yellow. CXCR4 residues involved in the binding are labeled in white. The β-strand of CXCR4 comprising residues E25–R30 is shown in cyan.

