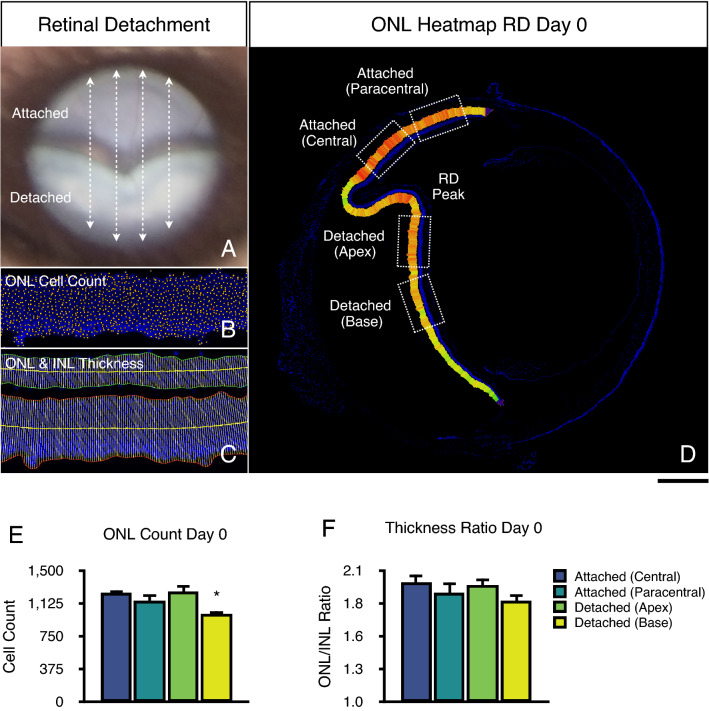
Figure 1.
Retinal detachment changes immediately after retinal detachment (baseline, day 0). (A) Representative fundus photo of a murine retinal detachment (RD) and sectioning planes (dashed arrows). (B) Cryosection image of a 400 µm ONL segment for ONL Cell Count at baseline analysis. (C) Cryosection image of a 400 µm ONL segment for outer (ONL) and inner nuclear layer (INL) thickness measurement. (D) Representative cryosection whole-retina tile image of a retinal detachment relative ONL thickness heatmap. Regions of interest used for analysis (dotted boxes). (E) ONL cell count analysis. (F) ONL/INL thickness ratio analysis. Scale bar = 400 µm (D). *p < 0.05 vs. attached central region (n = 4–7).

