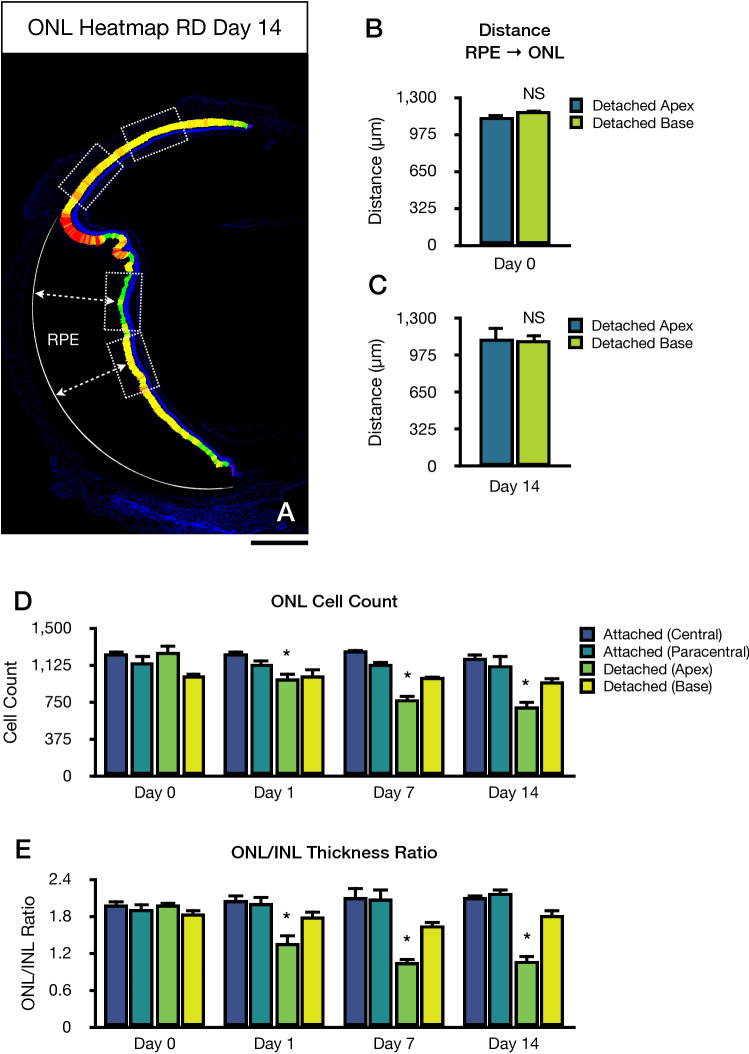
Figure 2.
Progressive outer nuclear layer (ONL) degeneration following retinal detachment. (A) Representative cryosection whole-retina tile image of a retinal detachment relative ONL thickness heatmap. Regions of interest used for analysis (dotted boxes), and retinal detachment height callipers (dashed arrows). (B) Height of retinal detachment at baseline. (C) Height of retinal detachment at day 14. (D) ONL cell count analysis. (E) ONL/INL thickness ratio analysis. Scale bar = 400 µm (A). *p < 0.05 vs. baseline day 0 between groups (n = 4–7).

