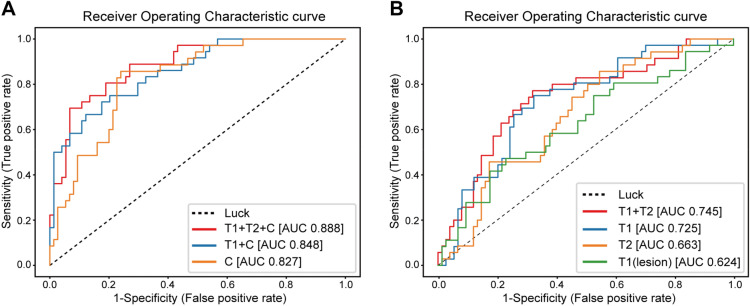
Figure 1.
Receiver operating characteristic curves showing the AUC values of different deep learning models in the validation set. (A) ROC curves for the prediction of pretreatment pCR based on different deep learning models trained on clinical information and MR images or only clinical information pCR classifiers. T1 + T2 + C: subtracted-T1W images, T2W images, and clinical information. T1 + C: T1W subtraction images and clinical information. C: clinical information. (B) ROC curves for prediction of pretreatment pCR based on different deep learning models trained on the dataset in the combinations of MR images. T1 + T2: T1W subtraction images and T2W images. T1: T1W subtraction images. T2: T2W images. T1 (lesion): cropped image of the lesion in T1W subtraction images.

