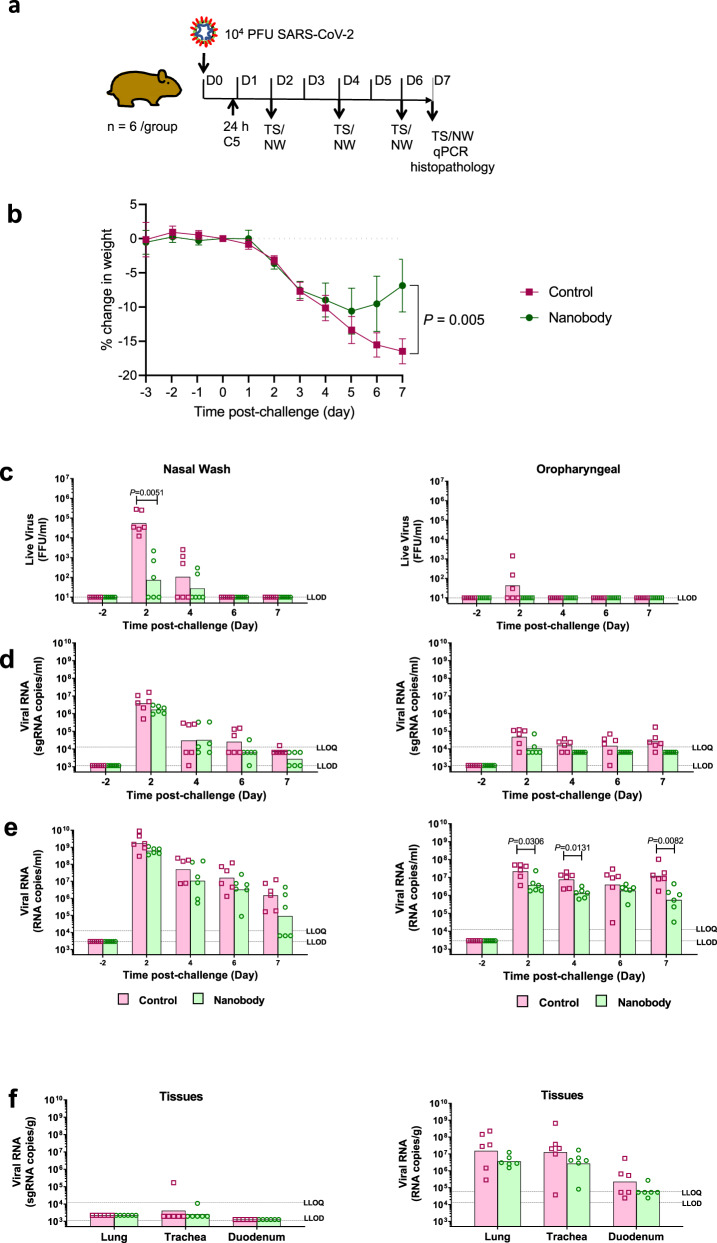
Fig. 6. C5-Fc neutralisation of SARS-CoV-2 in the Syrian hamster model.
a Golden Syrian hamsters (n = 6 biologically independent animals per group) were challenged with SARS-CoV-2 (B Victoria 5 × 10⁴ pfu) at day 0 and then treated with either C5-Fc (IP 4 mg/kg) or PBS, delivered by the intraperitoneal route 24 h post-challenge and Throat Swab (TS) and Nasal Wash (NS) samples collected on days 2, 4, 6 and 7 post virus challenge. b Body weight was recorded daily and the mean percentage weight change from baseline was plotted (mean ± 1 SE). Filled in square represents data from control animals (virus only) and filled in circles represents data from nanobody treated. Nasal washes (i–iii) and oropharyngeal swabs (iv–vi) were collected at days −2 to 2, 4, 6 and 7 pc for all virus challenged groups. Tissue samples (lung, trachea and duodenum) were collected at post-mortem (day 7 pc) (vii & viii). Open square represents data from control animals (virus only) and open circle represents data from nanobody-treated hamsters. Symbols show values for individual animals, columns represent the calculated group geometric means. c Quantitation of live virus in the nasal wash and oropharyngeal swabs using a micro-foci assay. d Number of copies of subgenomic (sg)viral RNA in the nasal wash and oropharyngeal swab. e Number of copies genomic viral RNA in the nasal wash oropharyngeal swab. f Number of copies of sgRNA and genomic RNA in tissues. The dashed horizontal lines show the lower limit of quantification (LLOQ) and the lower limit of detection (LLOD). The statistical test used was a Mann–Whitney’s U test, two-sided, using Minitab v 16.

