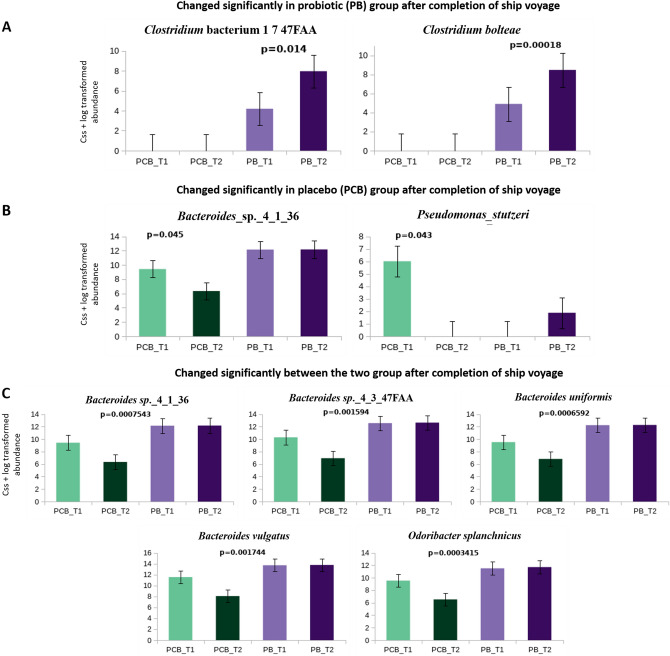
Figure 3.
Taxonomic composition (css + log transformed) at species level. A - At baseline, the species did not have a significant difference between PCB and PB groups, but changed significantly in PB group at the end of ship voyage. B - The species changed significantly only in PCB group during the ship voyage. C - The species abundance changed significantly between PCB and PB groups after completion of the ship voyage (PCB_T2 and PB_T2). p-value < 0.05 was considered to be statistically significant (Wilcoxon rank-sum tests) using in-house R-script. Error bar represents standard error mean (SEM).

