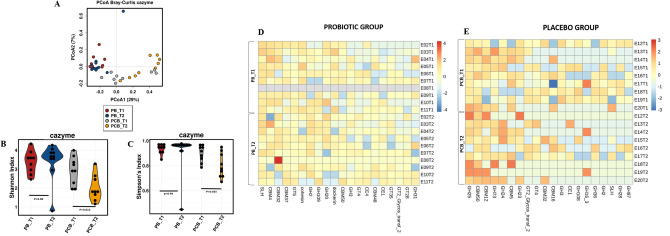
Figure 6.
Alterations of the gut microbial CAZy genes during the stressful ship voyage. A - The Bray–Curtis distance-based gut microbial CAZy gene profile of members during the ship voyage. The points in different colors represent the intestinal microbial structure of the subjects in each group. B, C - The alpha diversity, including Shannon and Simpson indexes, of the gut microbial CAZy genes of expedition members both in PCB and PB groups at baseline and at the end of the ship voyage. Significant change was observed between PCB_T1 and PCB_T2 (p < 0.05). D, E - The heatmap showing css + log transcformed abundance of top 20 abundant CAZy gene families, including glycoside hydrolases (GH) and carbohydrate binding moiety (CBM) in PCB group and PB group during the ship voyage. CAZy genes were filtered at E-value < 1e–18 and coverage > 0.35 for all bacteria using dbCAN HMMdb.

