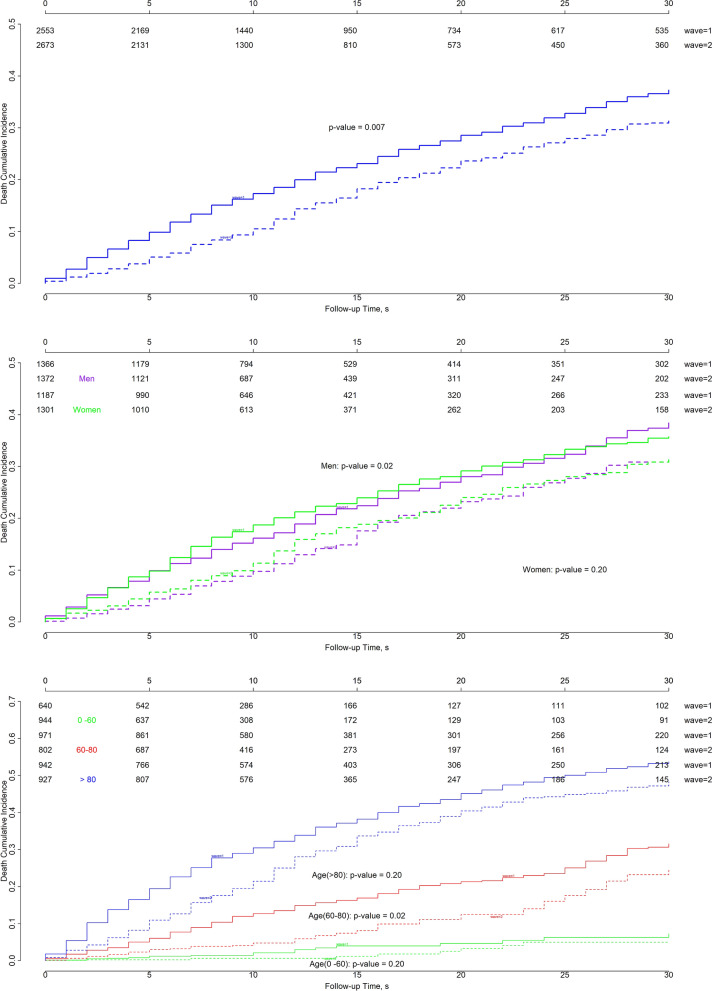
Figure 6.
Cumulative incidence of death for all patients (top), patients stratified by sex (middle), and patients stratified by age (bottom) in Aragon, Spain, February-September 2020. By sex: purple indicates men, green indicates women. By age: green indicates 0–60 years, red 60–80 years, and blue > 80 years. Solid lines: first wave; dashed lines: second wave. The p-values corresponds to the Gray test to compare survival curves between waves for groups stratified by sex or age.

