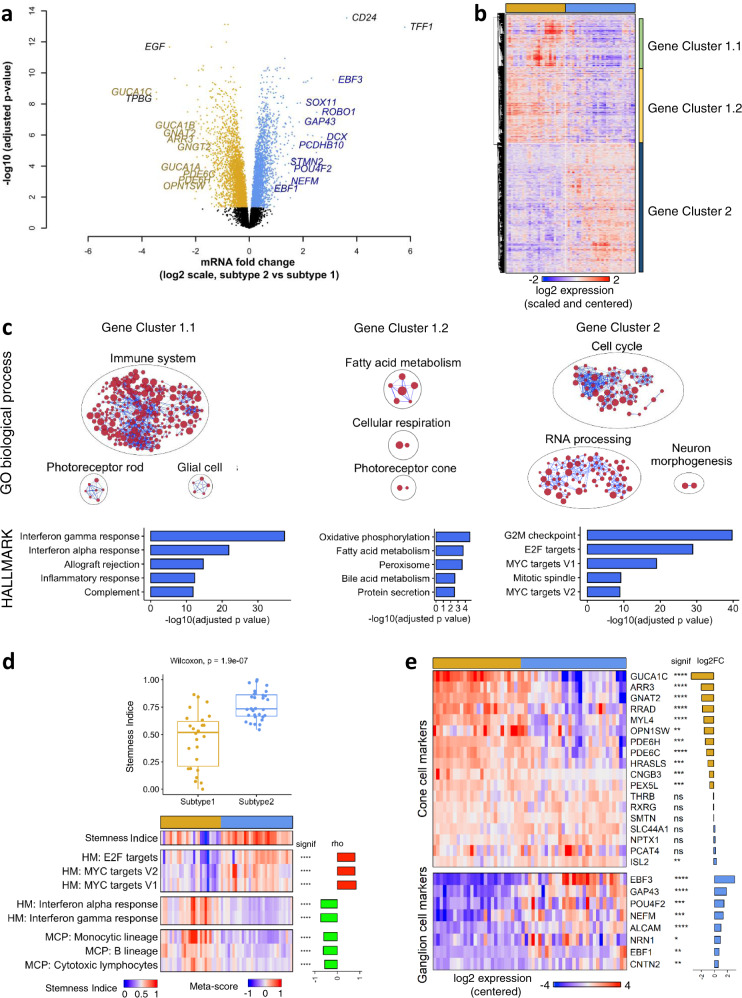
Fig. 3. Transcriptomic differences between the two retinoblastoma subtypes.
a Volcano plot with genes significantly upregulated in subtype 1 (n = 26) (gold) and subtype 2 (n = 31) (blue). The genes related to cone-cell and neuronal/ganglion-cell differentiation are indicated (in gold and blue, respectively), together with the most highly differentially expressed genes in each subtype. b Hierarchical clustering of the significantly differentially expressed genes identified three main gene clusters. c Upper panels: Gene sets from the GOBP collection enriched in clusters 1.1, 1.2, 2 in hypergeometric tests. Results are presented as networks of enriched gene sets (nodes) connected based on their overlapping genes (edges). Node size is proportional to the total number of genes in the gene set concerned. The names of the various GOBP terms are given in Supplementary Data 3. Bottom panels: Top 5 Gene sets from the HALLMARK collection enriched in clusters 1.1, 1.2, 2. d Upper panel: Boxplots of stemness indices, determined as in Malta et al.32, in the two subtypes of retinoblastoma (subtype 1 tumors: n = 26, subtype 2 tumors: n = 31). In the boxplots, the central mark indicates the median and the bottom and top edges of the box the 25th and 75th percentiles. Whiskers are the smaller of 1.5 times the interquartile range or the length of the 25th percentiles to the smallest data point or the 75th percentiles to the largest data point. Data points outside the whiskers are outliers. Significance was tested by a two-sided Wilcoxon test, p = 1.9 × 10⁻⁷. Bottom panel: Heatmap of stemness indices and meta-score of the most correlated and anti-correlated HALLMARK (HM) pathways and MCP-score of the most anti-correlated immune cells. Spearman’s rho and p-value are shown in the figure. p < 0.0001 (****). e Heatmap representing expression pattern of cone- and ganglion-associated genes in the two subtypes of retinoblastoma. Statistical significance and log2 fold-change in expression between subtype 2 and subtype 1 are also shown. Adjusted.p ≥ 0.05 (ns), adjusted.p < 0.05 (*), adjusted.p < 0.01 (**), adjusted.p < 0.001 (***), adjusted.p < 0.0001 (****). Limma moderated two-sided t-tests and BH correction were used. Exact p-values are provided in Supplementary Data 3.

