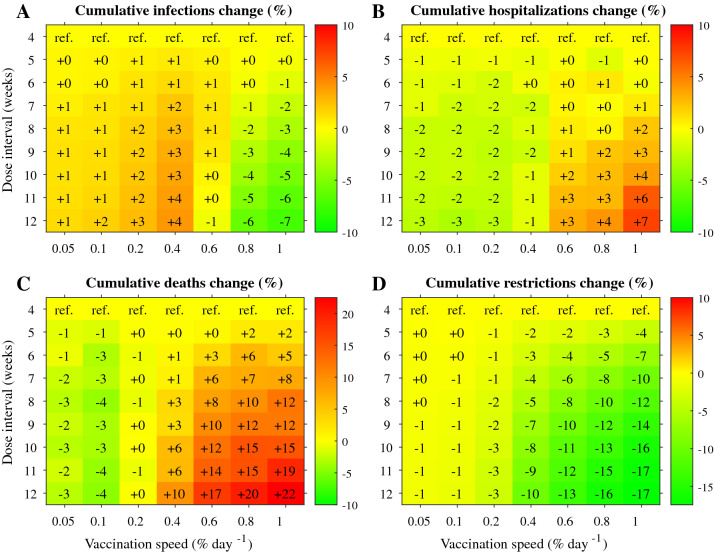
Figure 5.
Heatmaps showing the impact of dose intervals and vaccination speed on (A) infections, (B) hospital admissions, (C) mortality, (D) and the AUC of non-pharmaceutical public health restrictions, when using the Oxford/AstraZeneca vaccine efficacy data. A 4-week dose interval was used as a reference, and all changes are given as percentages with respect to the reference scenario. Default parameters are gathered in Table 1 of Appendix 1.

