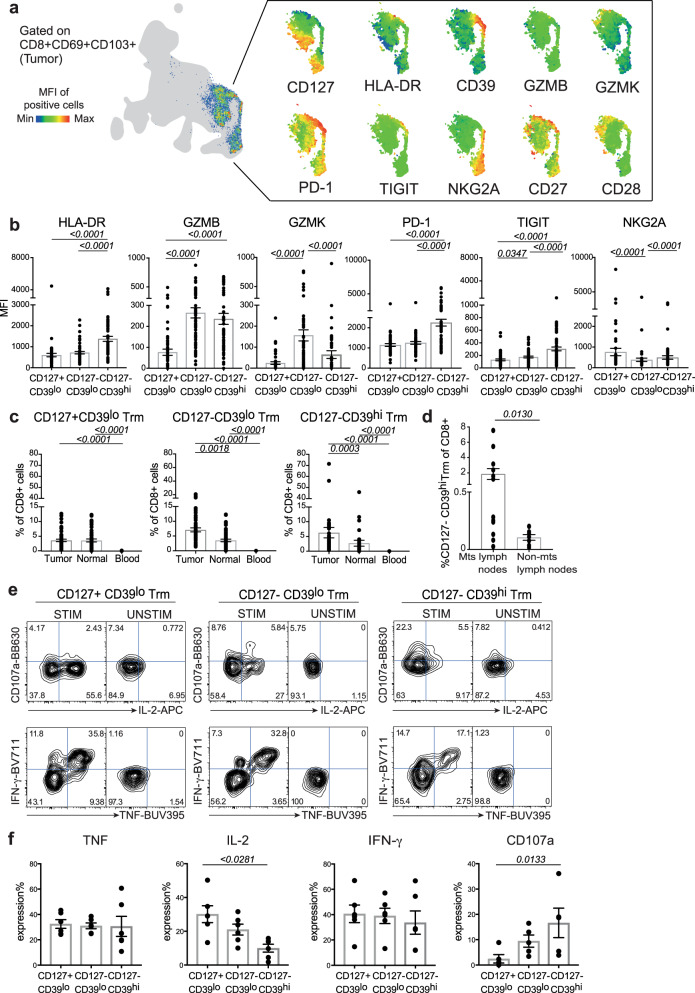
Fig. 2. CD8+ Trm cells are phenotypically and functionally heterogeneous in BC.
a UMAP representation of the relative expression of selected markers analyzed by flow cytometry by manually gated CD8+ CD69+ CD103+ Trm cells concatenated from tumor samples (n = 49 biologically independent samples). The gray area refers to the total CD8+ T-cell subpopulation. b Mean ± SEM summary of the MFI of different activation, coinhibitory and costimulatory markers by CD127+ CD39lo, CD127− CD39lo, and CD127− CD39hi Trm subpopulations from tumor samples (n = 54 biologically independent samples), as defined by flow cytometry. Numbers indicate the exact p values; one-way ANOVA with Friedman test. c Bar plots showing the frequency depicted as mean ± SEM of CD127+ CD39lo, CD127− CD39lo, and CD127− CD39hi in CD8+ cells among different tissue compartments (tumor, normal breast, and peripheral blood; n = 54 biologically independent samples). Numbers indicate the exact p values for tumor vs. peripheral blood or normal tissue samples; one-way ANOVA with Friedman test. d Mean ± SEM summary of the frequency of CD127− CD39hi Trm among total CD8+ cells in metastatic (mts; n = 12 biologically independent samples) and nonmetastatic (non-mts; n = 7 biologically independent samples) lymph nodes (LN). Numbers indicate the exact p value; Mann–Whitney test. Data were obtained in one experiment. e Flow cytometry plots from a representative patient showing the production of CD107a, IL-2, TNF, and IFN-γ by BC tumor-infiltrating CD8+ Trm subsets in response to PMA/ionomycin stimulation (STIM) in vitro. Numbers in the histograms indicate the percentage of positive cells identified by the gates. UNSTIM unstimulated control. f Mean ± SEM summary of the frequency of effector molecules expression from e (n = 6 biologically independent samples; performed in two independent experiments). Numbers indicate the exact p value; one-way ANOVA with Friedman test.

