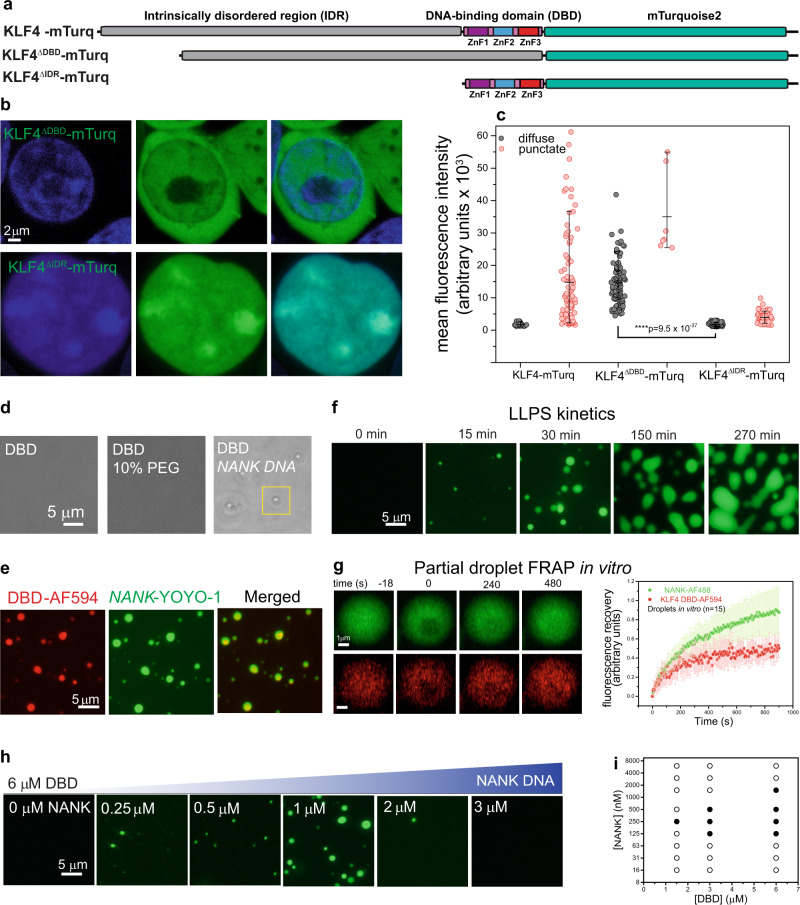
Fig. 2. The KLF4 intrinsically disordered region is dispensable for biomolecular condensation.
a Domain organization of KLF4-mTurq constructs. b Fluorescence microscopy of mTurq fusions and DNA (Hoechst) in HEK 293T cells. KLF4ΔDBD-mTurq (top) is found throughout cells and is diffuse in the nucleus; KLF4ΔIDR-mTurq (bottom) localizes to the nucleus and forms condensates. Similar results were obtained results for 2 biological replicates. c HEK 293T cells expressing KLF4-mTurq variants classified as diffuse (gray) or punctate (red) are plotted by their mean fluorescence intensity; the long horizontal bars mark the median, and the top and bottom bars on the vertical lines denote the 90-10 percentiles. Diffuse cells expressing deletion constructs show very different fluorescence levels (statistical tests were performed using a two-sided Student’s paired t-test; P value shown; n = 105 cells each). KLF4ΔIDR-mTurq expresses poorly and 48% of cells are punctate (n = 97); KLF4ΔDBD-mTurq expresses well and 6% of cells are punctate (n = 7). Similar results were obtained for 2 biological replicates. d Bright field microscopy of 6 µM KLF4 DBD (left), with 10% PEG-8K (center) or 1 µM NANK (right) in TS buffer (12.5 mM Tris, 70 mM NaCl, pH 7.4). e Fluorescence microscopy of 6 µM DBD in TS buffer (with 50 nM DBD-AF594; red) and 1 µM NANK (with 100 nM YOYO-1; green); yellow droplets in merge indicate colocalization. Similar results were obtained for 2 replicates. f Fluorescence microscopy of DBD:NANK droplet time course taken at a focal plane close to the surface. Droplets form, grow, fuse and wet the surface. Similar results were obtained for >10 replicates. g FRAP of droplets monitoring NANK-AF488 (green; top row) or KLF4 DBD-AF594 (red; bottom row). Curves (at right) show mean and standard deviation for 15 droplets. h DNA concentration dependence of DBD:DNA liquid–liquid phase separation (LLPS). Fluorescence microscopy images of 6 µM DBD with NANK DNA (0–3 µM) in TS buffer with 100 nM YOYO-1 (green) after 30 min incubation. i LLPS measurements at various DBD and NANK concentrations; solid/open circles indicate LLPS/no LLPS. Images are scored as LLPS if the coefficient of variation (CV, standard deviation/mean pixel intensity) is >0.2 and the mean fluorescent intensity is >0.4 arbitrary units. Values were determined using ImageJ for 2–3 independent replicates.

