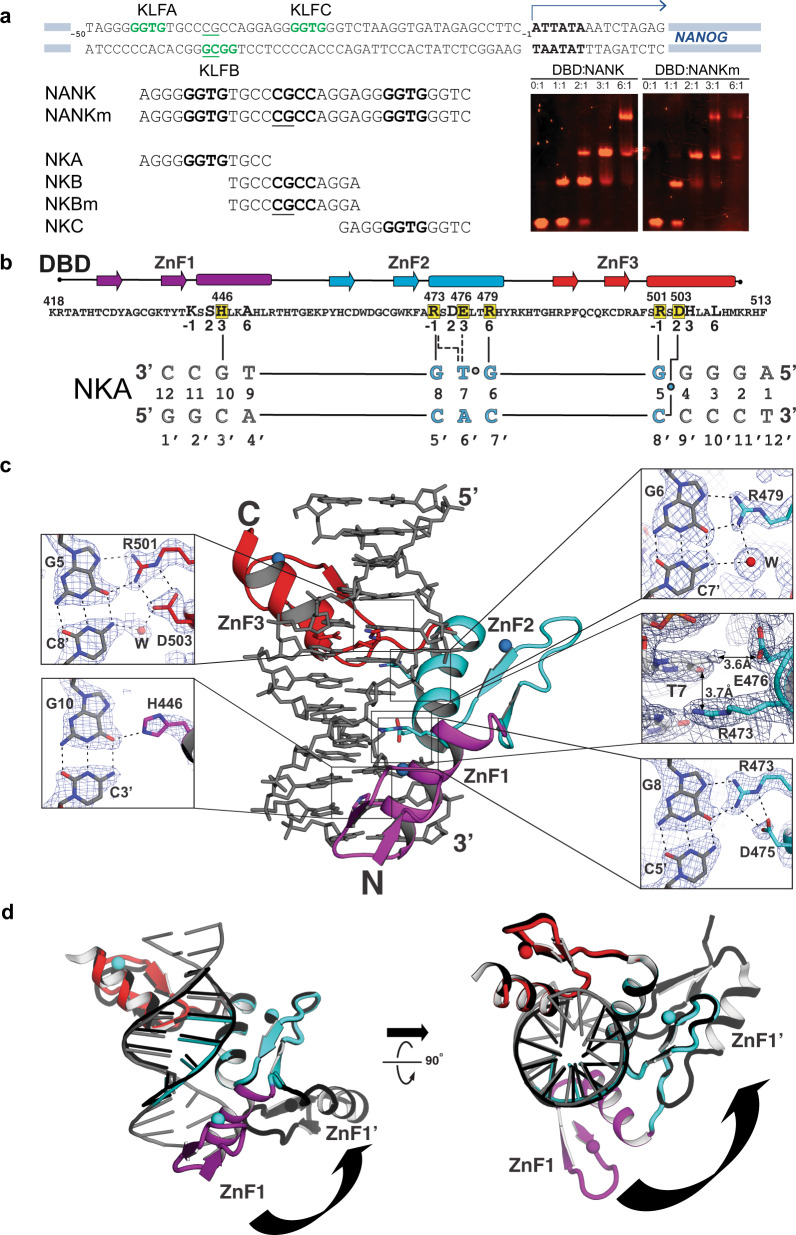
Fig. 3. Structural determinants of DBD:NANK interactions.
a Schematic of the NANOG promoter (top) and studied DNA duplexes (bottom left) with GG(T/C)G sites in bold and mCpG sites underlined. Electrophoretic mobility shift assays (bottom right) with 0–6 µM DBD and 1 µM DNA (NANK or NANKm) were stained with EtBr (red) for two independent replicates. b DBD contacts with the NKA dodecamer. (Top) DBD sequence and secondary structure for ZnF1 (magenta), ZnF2 (cyan) and ZnF3 (red). (Bottom) NKA sequence numbered 5′-to-3’; GGTG motif in cyan. DBD residues that contact DNA bases are highlighted in yellow; numerals −1, 2, 3, or 6 refer to the canonical C2H2 recognition code39. Solid (or dotted) vertical lines indicate hydrogen bonds (or van der Waals contacts). c Crystal structure of DBD bound to the NKA dodecamer (middle) and close-up views (sides) with 2Fo–Fc electron density maps contoured at 1.0 σ. Three ZnFs, colored as in (b), wrap around the DNA (gray) with zinc ions as blue spheres, residues and bases colored by atom type (carbon, black; nitrogen, blue; oxygen, red), hydrogen bonds as black dotted lines, and van der Waals contact distances marked with black arrows. d Superposition of DBD:NKA complex (same colors as above) and a previous DBD:DNA complex (PDB ID: 2wbs, black) shown in two views related by a 90° rotation. ZnF1 in 2wbs is rotated away from the DNA axis compared to our complex (arrow).

