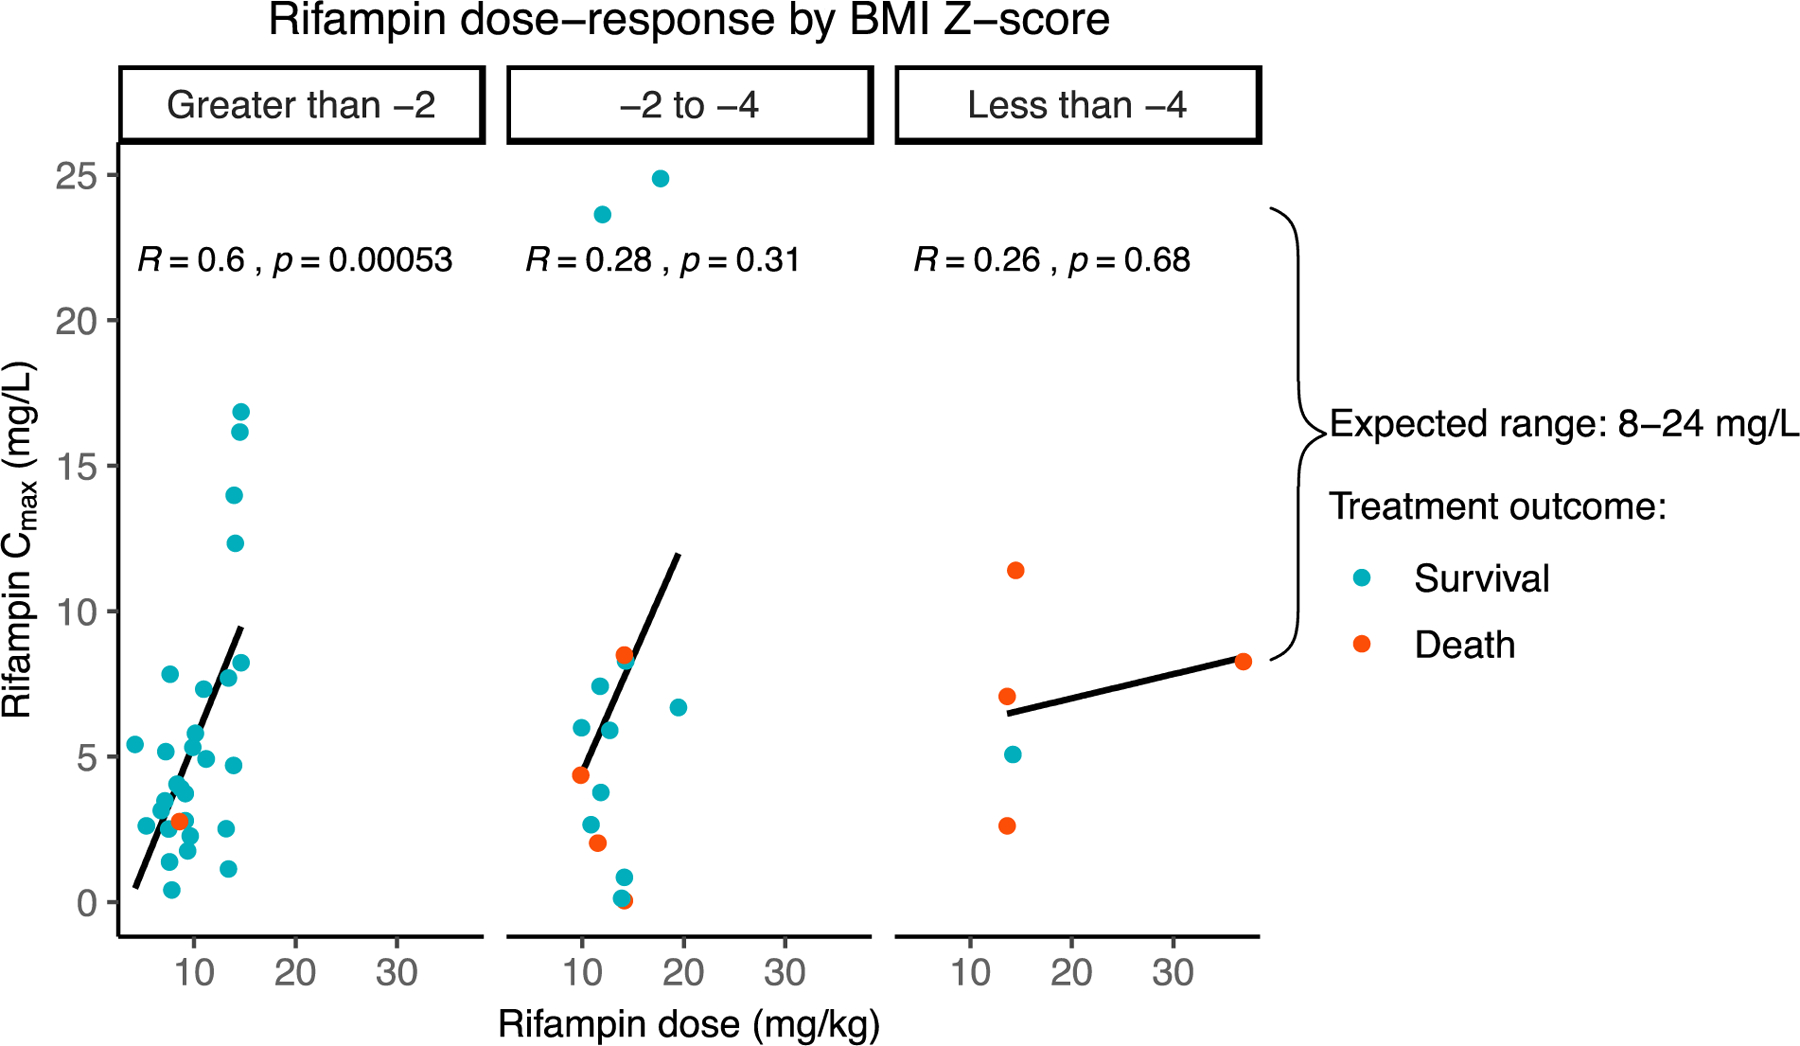
Figure 2: Malnourished Tanzanian children with tuberculosis have altered rifampin dose-response and increased mortality.

Scatterplot of peak rifampin concentration versus rifampin dose among 51 pediatric PLWTB in Haydom, Tanzania with body mass index BMI z-scores less than −2, −2 to −4, and less than −4, with greater pharmacokinetic variability in those with lower BMI z-scores. Mortality is indicated in red: 9/51 (17%) died during treatment, with 8/9 (89%) deaths occurring in PLWTB with baseline BMI Z-score less than −2.36 (Cmax: peak concentration; BMI: body mass index; PLWTB: persons living with TB)
