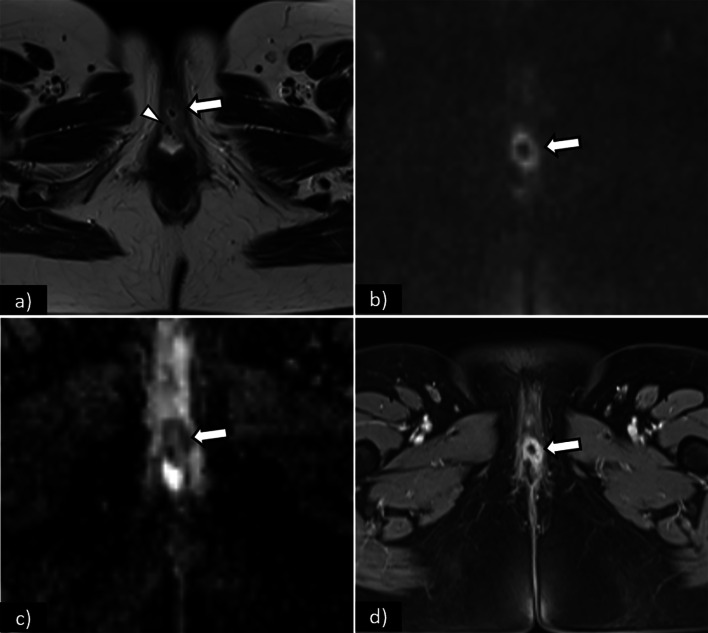
Fig. 5.
Axial T2WI (a) shows an intermediate signal intensity tumour (arrow), measuring 3 cm, with central necrosis and invasion of the external urethral meatus (arrowhead)—FIGO II. On DWI, the tumour is depicted by a high-signal intensity lesion on DWI (b-value = 1000 s/mm2) (arrow), and low-signal intensity on the corresponding ADC map (arrow). On T1WI fat saturation contrast-enhanced sequence (d), the tumour shows early arterial enhancement of its solid component (arrow), with no enhancement of the central necrotic portion. Note the increased conspicuity of the lesion in DWI-MRI (b) and c and in DCE-MRI (d)

