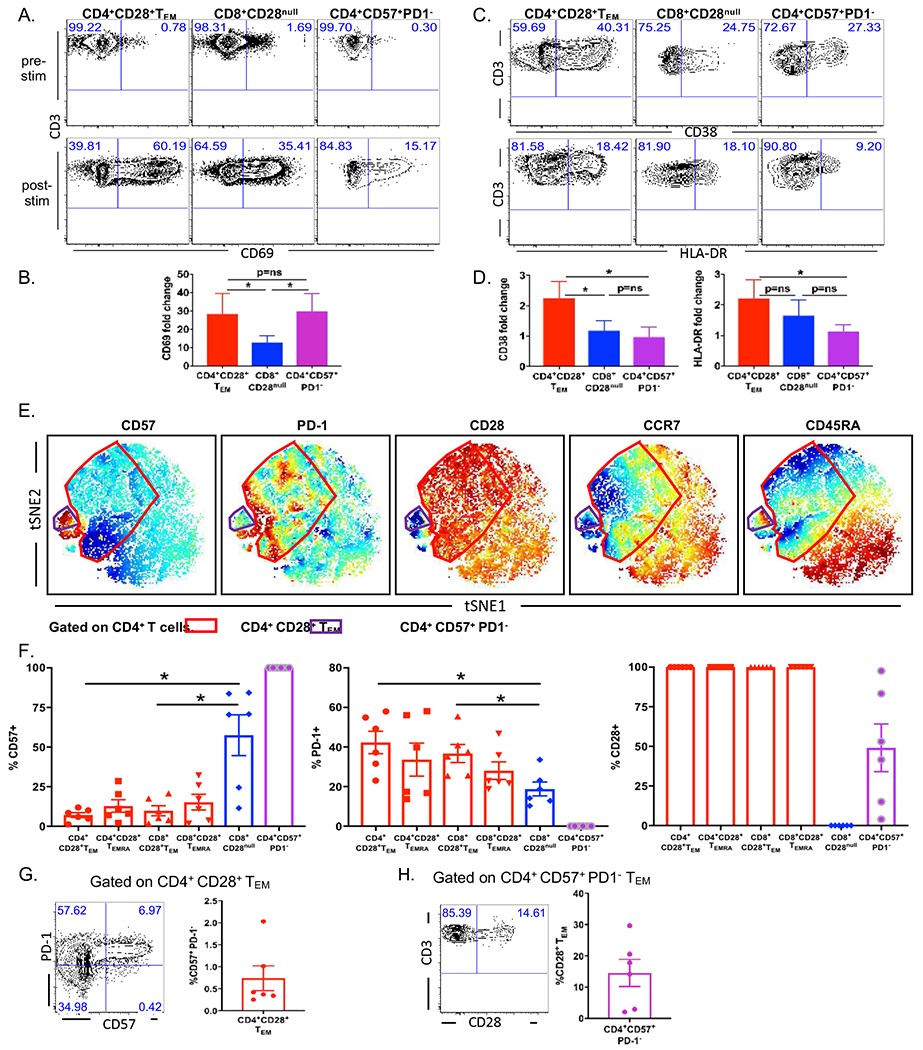
Figure 2. CD4+ CD28+ TEM and CD4+ CD57+ PD1− subsets exhibit high CD69 upregulation and CD4+ CD28+ TEM exhibit high CD38 and HLA-DR upregulation following stimulation.

Human PBMCs from healthy donors were stimulated ex vivo with anti-CD3/CD28 beads for 3 d followed by brief restimulation in the presence or absence of PMA/Iono. PBMCs were analyzed directly ex vivo or following in vitro stimulated as described above by flow cytometry. (A) Representative flow plots of frequencies of CD69+ cells within risky memory T cell subsets pre-(top) and post-(bottom) stimulation. (B) Summary data of fold changes of frequencies of CD69+ cells within risky memory T cell subsets upon stimulation. (C) Representative flow plots of frequencies of CD38+ and HLA-DR+ cells within risky memory T cell subsets post-stimulation. (D) Summary data of fold changes of frequencies of CD38+ and HLA-DR+ cells within risky memory T cell subsets upon stimulation. (E) Representative viSNE plots of the median fluorescence intensity (MFI) of CD57, PD-1, CD28, CCR7 and CD45RA within the CD4+ T cell compartment. Red indicates high expression of a given marker, and blue represents low intensity. The red-rimmed population represents CD4+ CD28+ TEM subset, and the purple-rimmed population indicates CD4+ CD57+ PD1− subset. (F) Summary data of frequencies of CD57+, PD-1+ and CD28+ cells within risky memory T cell subsets (*, p < 0.05; n = 6 per experiment; data are representative of three independent experiments. Risky memory T cell subsets were defined by the following gating strategy: CD4+ CD28+ TEM, CD3+ CD4+ CCR7− CD45RA− CD28+; CD8+ CD28null, CD3+ CD8+ CD28−; CD4+ CD57+ PD1−, CD3+ CD4+ CD57+ PD1−; CD4+ CD28+ TEMRA, CD3+ CD4+ CCR7− CD45RA+ CD28+; CD8+ CD28+ TEM, CD3+ CD8+ CCR7− CD45RA− CD28+; CD8+ CD28+ TEMRA, CD3+ CD8+ CCR7− CD45RA+ CD28+). G, Frequencies of CD57+ PD-1− cells within the CD4+ CD28+ TEM subset. H, Frequencies of CD28+ TEM cells within the CD57+ PD-1− subset.
