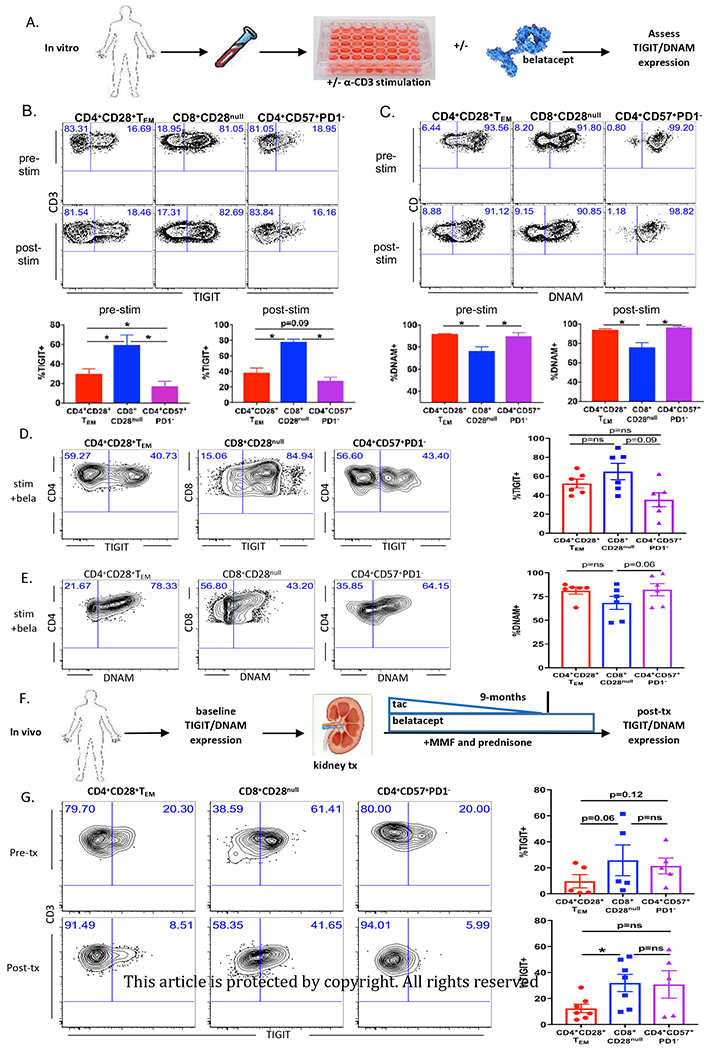
Figure 3. TIGIT expression is maintained on “risky” memory T cell subsets in vivo and in vitro in the presence of belatacept.

(A) Schematic of experimental design. Peripheral blood T cells from healthy donors were stimulated ex vivo with anti-CD3 in the presence or absence of belatacept. Risky memory T cell subsets were defined as in Figure 1. Representative flow plots and summary data of frequencies of TIGIT+ cells (B) and DNAM+ cells (C) within risky memory T cell subsets pre- and post-stimulation. TIGIT (D) and DNAM (E) expressions were assessed on risky memory T cell subsets in the setting of belatacept (*, p < 0.05; n = 6 per experiment; data are representative of three independent experiments). (F) Schematic of experimental design. Peripheral T cells from renal transplant patients treated with belatacept as described in (8) were analyzed directly at baseline or following transplantation. (G) TIGIT expression was assessed on risky memory T cell subsets in vivo belatacept-treated transplant patients (*, p < 0.05; n = 5-7 per experiment; data are representative of four independent experiments).
