
Fig. 3.
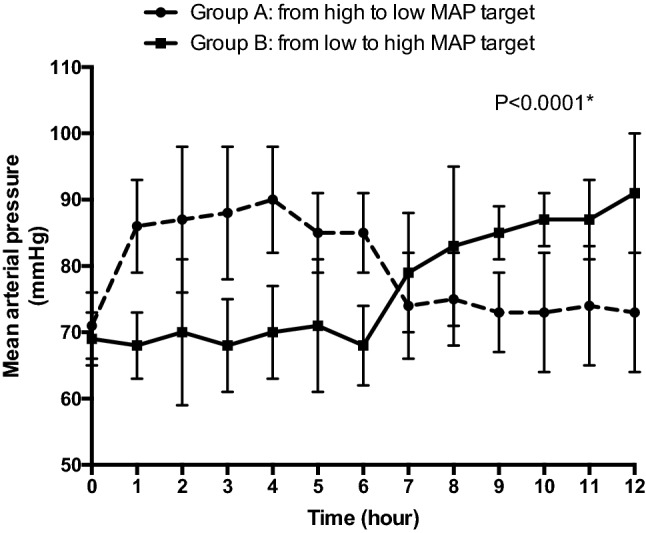
MAP evolution during the high-MAP target period and the low-MAP target period. *P values for the within-subject comparison of MAP using a multivariate repeated-measures analysis of variance (MANOVA)
Official websites use .gov
A
.gov website belongs to an official
government organization in the United States.
Secure .gov websites use HTTPS
A lock (
) or https:// means you've safely
connected to the .gov website. Share sensitive
information only on official, secure websites.
MAP evolution during the high-MAP target period and the low-MAP target period. *P values for the within-subject comparison of MAP using a multivariate repeated-measures analysis of variance (MANOVA)