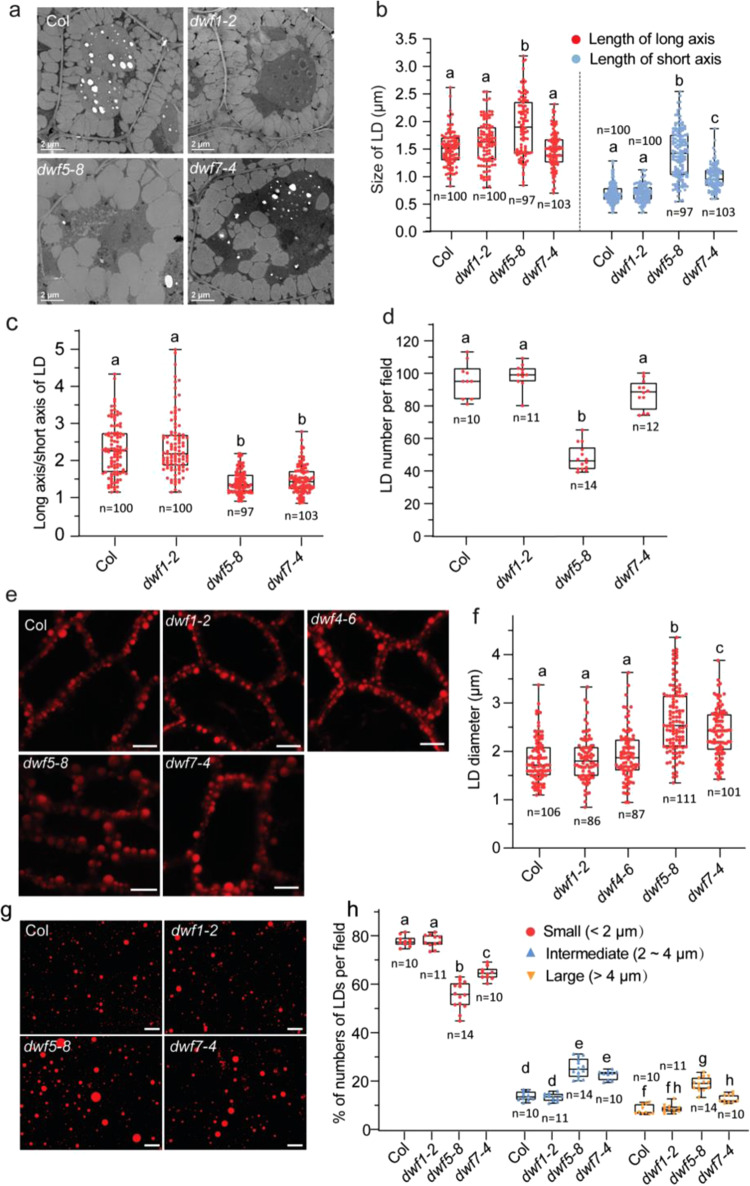
Fig. 6. Changes in LD morphology in dwf5 and dwf7 mutants.
a TEM images of LDs in mature seeds of wild type and dwf mutants. The experiment was repeated 3 times with similar results. Bar = 2 μm. b Size of LDs. c Long axis to short axis ratios of LDs. d LD number per field of TEM. e Representative confocal images of LD in the hypocotyl epidermis of wild type and dwf mutants. LDs of 3-day-old seedlings were stained with Nile Red and visualized in the hypocotyl epidermis next to the radicle by confocal microscope. The experiment was repeated three times with similar results. Bar = 10 μm. f Diameter distribution of LDs from hypocotyl epidermis of wild type and dwf mutants. g Representative images of isolated LDs. LDs were isolated from dry seeds, stained with Nile Red and visualized with a Zeiss epifluorescence microscope. The experiment was repeated 3 times with similar results. Bar = 20 μm. h Percentages of different sizes of isolated LDs per microscopic field. Small LDs, diameters < 2 μm; intermediate LDs, diameters between 2 and 4 μm; large LDs, diameters larger than 4 μm. Numbers in d and h represent the number of microscopic fields analyzed for data collection. Numbers in b, c and f indicate the number of LDs analyzed. In b, c, d, f and h, the box plot boundaries reflect the interquartile range, the center line is the median and the whiskers represent 1.5 × the interquartile range from the lower and upper quartiles. Different letters indicate significant differences at P < 0.05, as determined by one-way ANOVA with Tukey’s multiple comparisons test.

